Skip to content
Logo โ€” Itโ€™s All AboutThe Team
  • Home
  • Who We Serve
    • By Category
      • SaaS
      • Professional Services
      • Platforms (Large Ecosystems)
      • Private Equity
    • By Role
      • Chief Revenue Officers (CRO)
      • Chief Financial Officers (CFO)
      • Chief Marketing Officers (CMO)
      • Chief Executive Officers (CEO)
      • Sales Leaders
      • Partnership Professionals
  • Solutions
    • By Partner Program Maturity
      • Partnerships Foundation
      • Partnerships Acceleration
      • Ecosystem-Wide Orchestration
    • Specialized Solutions
      • Net-New Named Account Development
      • Large Ecosystems
      • M&A: Post-Acquisition Internal Cross-Selling
  • Pricing
  • Education
  • Company
    • Our History
    • Security
  • Login
Back to all blogs
  • Account Mapping
Alex Buckles

Partner Ecosystem Map: Building One That Drives GTM

A head of partnerships and a CRO at a small conference table reviewing a printed partner ecosystem map with tier classifications and joint motion labels alongside a wall monitor showing partner overlap density by segment, deep navy and warm amber palette

What is a partner ecosystem map?

Short answer: A partner ecosystem map is the structured visualization and classification of every partner in a company’s go-to-market ecosystem, with named tiers, partner-type categories (SI, ISV, reseller, marketplace, agency, alliance), joint motion labels, and overlap density per partner per segment. It exists because a company cannot make sound investment decisions across forty to four hundred partners without a structured view; treating every partner as equal produces a misallocated quarter and a low-conviction forecast.

The shortcut is to build the ecosystem map as a working artifact, not a slide. The map has to drive real decisions (which partners get headcount, which get MDF, which get marketplace listings, which get sunset) inside a recurring quarterly investment review. Until it drives the decisions, it is wall art.

Why a partner ecosystem map matters in 2026

Three forces have made the partner ecosystem map a strategic artifact rather than a marketing visualization. First, partner counts at mature programs have grown into the hundreds, and the partnerships team cannot tier or invest by intuition anymore. Second, the marketplace and ecosystem motions have stratified across hyperscalers, ISV alliances, and regional resellers, and each has a different operating model that needs to be visible on the map. Third, finance is asking partnerships to justify investment per partner per quarter, and the map is the artifact that supports that conversation.

A working partner ecosystem map is structured, refreshed quarterly, and consumed in the executive partner business review. The teams that produce results have built it as a decision-support tool with named tiers and named joint motions; the teams that produce nothing have built a list with logos.

The shortcut is to start with three tiers and four partner types, classify the full roster, and refresh quarterly. The classification has to drive the next quarter’s investment, or the map is decoration.

How a partner ecosystem map actually works

A working ecosystem map runs on five components. Each component is built by named owners (head of partnerships, partnerships RevOps) and consumed in the quarterly investment review.

Five-component partner ecosystem map structure with tiers, types, joint motions, and quarterly review.

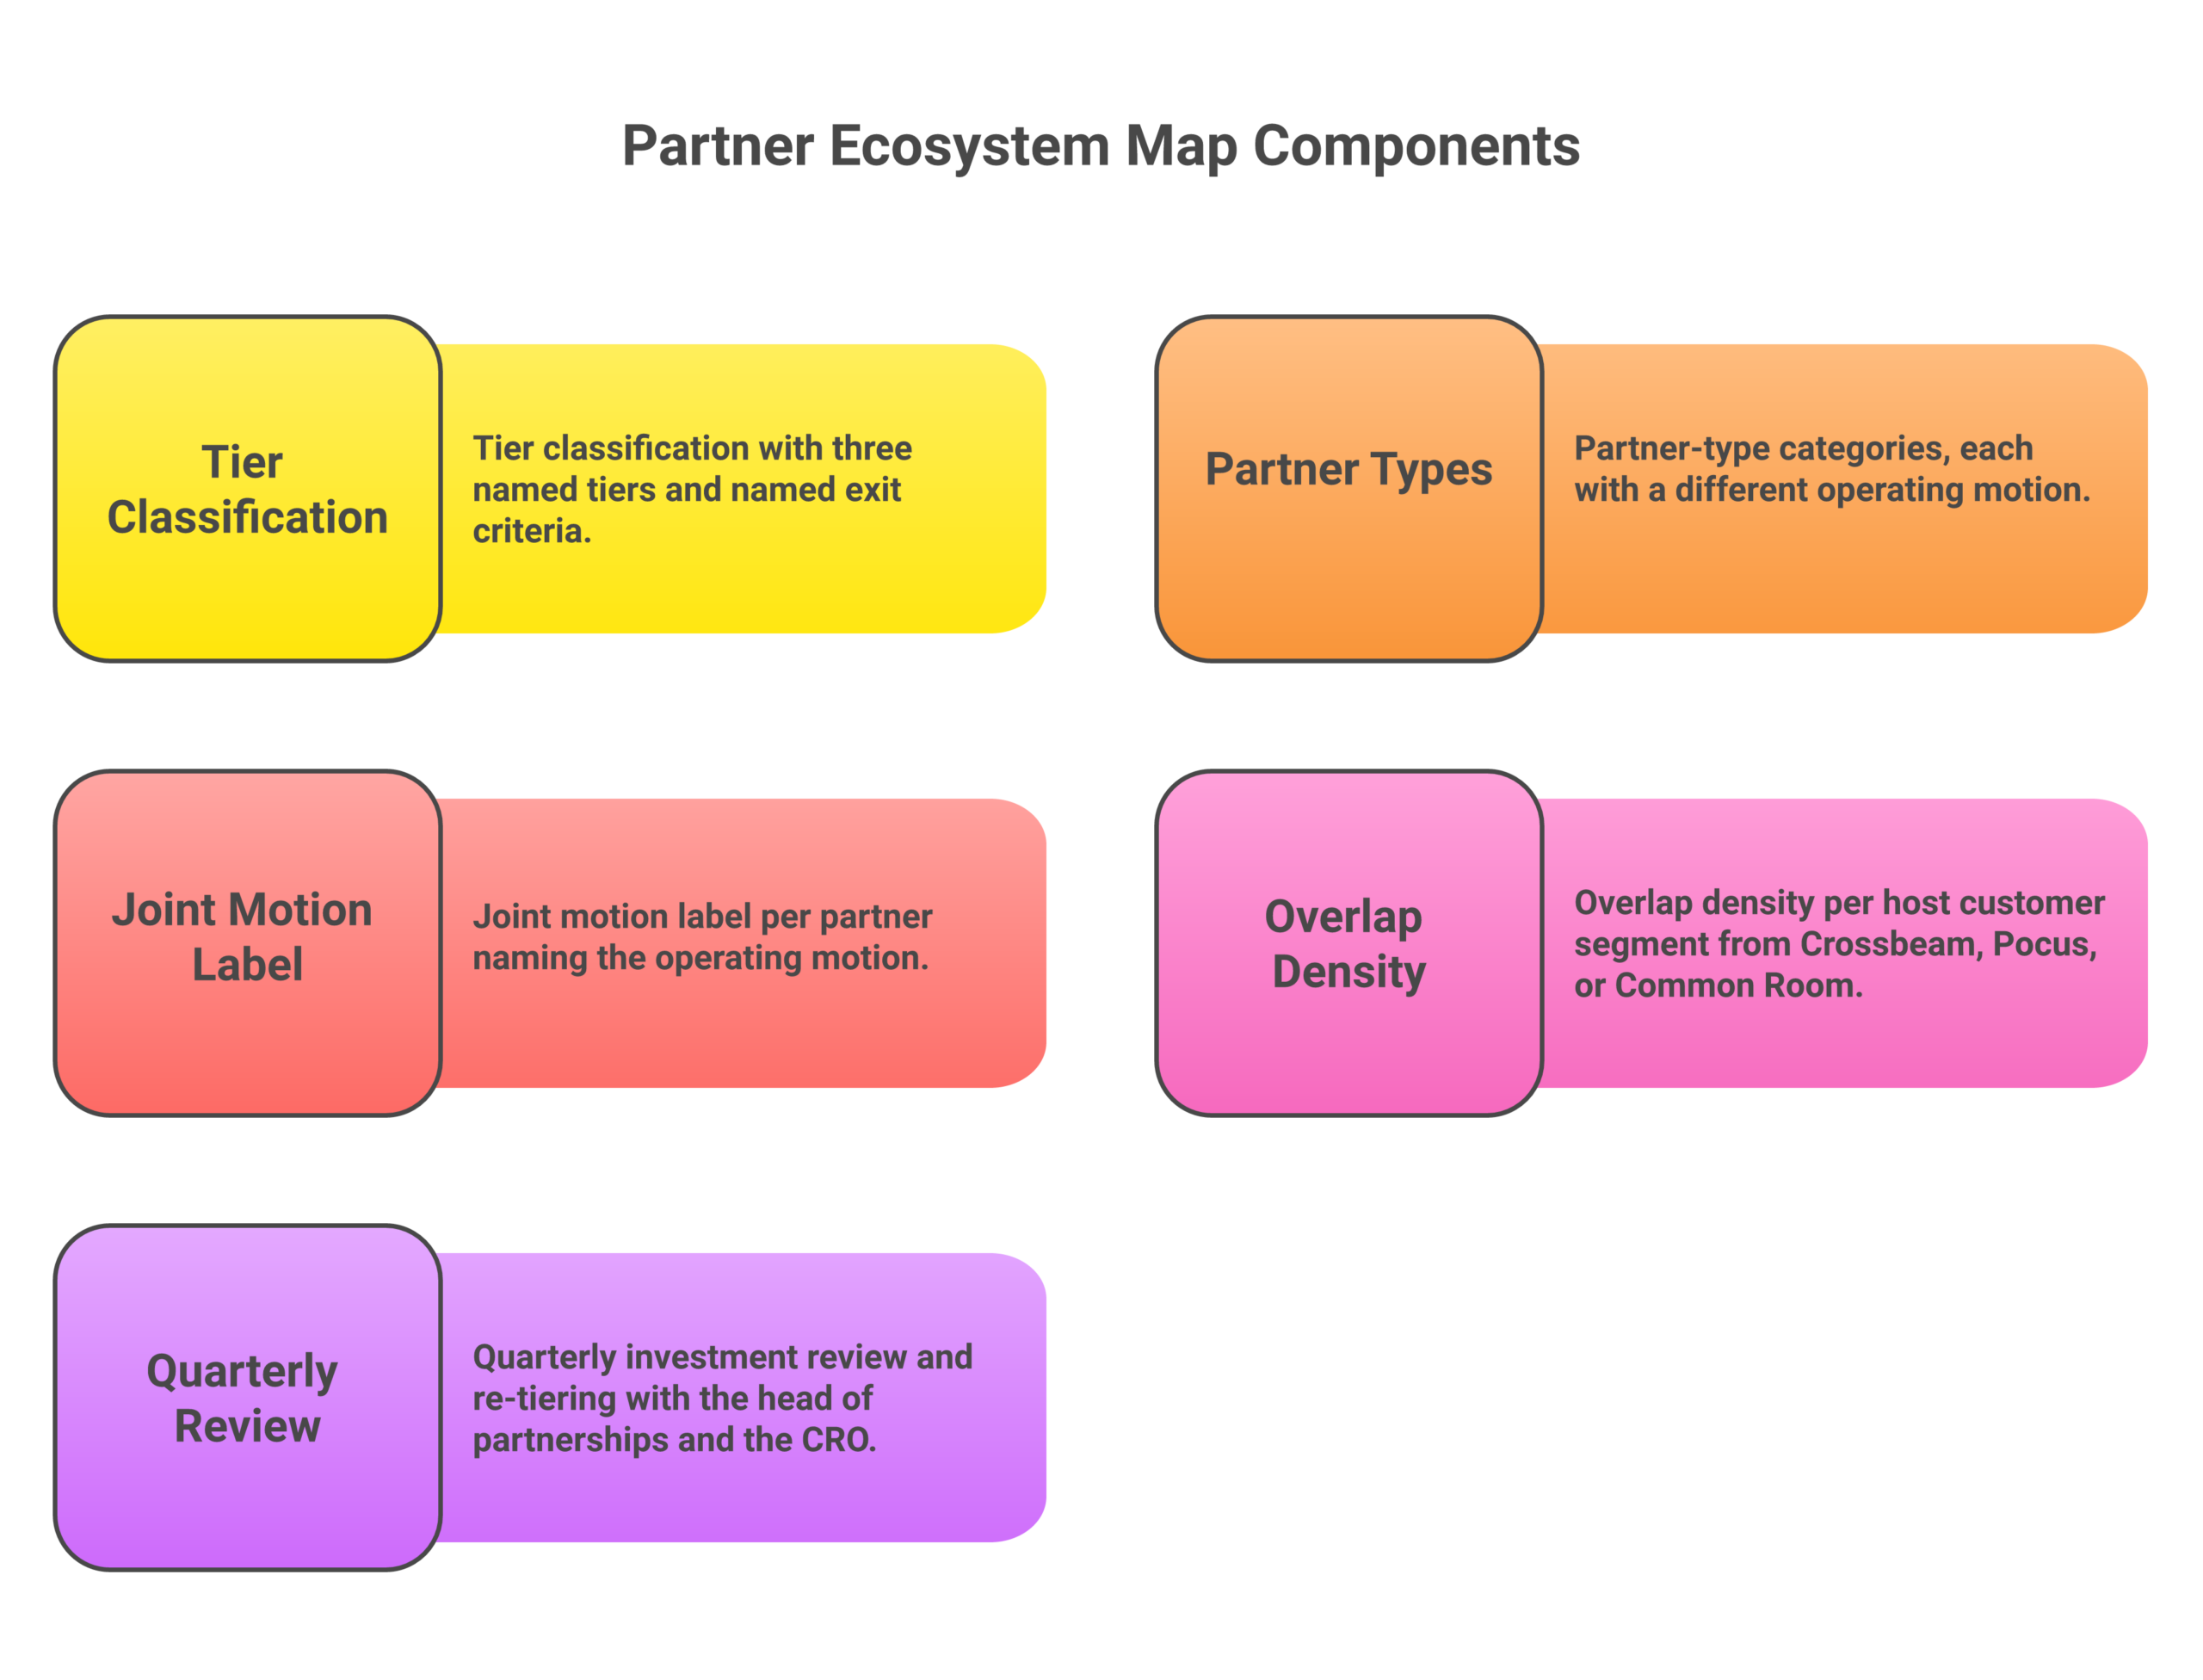
  1. Tier classification with three named tiers: Tier 1 (strategic, named ten to thirty partners, dedicated partner manager, named joint motions, MDF allocation), Tier 2 (managed, named thirty to a hundred partners, shared partner manager, scoped joint motions), Tier 3 (transactional, the long tail, self-serve workflow). Each tier has named exit criteria for moving up or down.
  2. Partner-type categories: SI (services-led, deal-room workflow), ISV (technology integration, co-sell motion), reseller (channel-led, margin-driven), marketplace (hyperscaler co-sell), agency (marketing-led, lead-flow motion), alliance (multi-partner strategic motion). The categories drive the joint motion design.
  3. Joint motion label per partner: A short label that names the operating motion (co-sell, marketplace listing, MDF event cadence, joint marketing, deal registration only). The label is what the partner manager runs; without it, the partner has a tier but no motion.
  4. Overlap density per segment: Crossbeam, Pocus, or Common Room data showing the partner’s overlap density per host customer segment (commercial, mid-market, enterprise, regulated). Density informs the joint target account list and the motion design.
  5. Quarterly investment review and re-tiering: Every quarter, the head of partnerships and the CRO review the map, re-tier where the data has moved, reallocate headcount and MDF, and sunset Tier 3 partners that have not produced. The review is the decision moment; the map is the data input.

The cycle produces a partnership investment plan finance can underwrite.

Common pitfalls in building a partner ecosystem map

  • Treating the map as a visualization instead of a decision-support tool: A slide with logos arranged in a wheel does not drive investment decisions. The map has to be a structured artifact (tier, type, joint motion, overlap density) that feeds the quarterly investment review.
  • No named exit criteria for tier movement: Without criteria, tier assignment is political. A Tier 2 partner that has produced six co-sell deals in two quarters should move to Tier 1; a Tier 1 partner that has produced nothing in two quarters should move to Tier 2 or sunset. The criteria have to be written and signed.
  • Skipping the partner-type category: Two partners at Tier 1 with different partner-type categories (SI vs ISV vs marketplace) need different operating motions. A map without the category dimension produces a single motion design that fits none of the partners.
  • No quarterly refresh: A partner ecosystem map built once and never refreshed is a snapshot of a moment. The roster changes, the overlap density moves, the joint motions evolve; quarterly refresh keeps the map operational.
  • One-page map for a hundred-partner roster: A single page cannot carry the structure for more than thirty partners. Tier 1 fits on a page; Tier 2 and Tier 3 live in a structured database with the same dimensions, surfaced as needed.

What this looks like in practice

A mid-market B2B SaaS team had ninety active partners and was investing partner manager time evenly across the roster. The head of partnerships and the CRO ran a four-week ecosystem-map design sprint: classified the ninety partners into three tiers (twelve Tier 1, twenty-eight Tier 2, fifty Tier 3) and six partner types, labeled the joint motion per Tier 1 and Tier 2 partner, and pulled overlap density per segment from Crossbeam. The first quarterly investment review reallocated three partner managers from the long tail to the Tier 1 roster, doubled MDF on the top five Tier 1 partners, and sunset eleven Tier 3 partners that had not produced in two quarters. Within two quarters, partner-sourced pipeline had moved from forty-eight to seventy-one million dollars annualized, the headcount investment had stayed flat, and the executive partner business review was running against the map instead of against anecdotes.

Forecastable’s POV on partner ecosystem maps

The partner ecosystem map is the operating model decision-support artifact for a partnerships function. The teams that build it as a structured working tool make better quarterly investment decisions; the teams that build it as a slide produce decoration. The map has to drive the next quarter’s headcount, MDF, and sunset decisions, or it is not earning its place in the operating cadence.

The deeper read is that the map is the artifact that lets a partnerships function operate at scale. A program with forty partners can operate on intuition; a program with two hundred cannot. The map turns intuition into structured decision data, and structured decision data is what finance and the CRO are asking for.

The candor on the tier-count question is that three tiers is enough for almost every program. A fourth tier sometimes makes sense for a “strategic alliance” layer above Tier 1, but most programs that introduce a fourth tier are managing complexity that does not need to exist. Start with three; add a fourth only if the operating reality demands it.

The candor on the partner-type category is that the category matters more than the tier. A Tier 2 ISV and a Tier 2 SI need fundamentally different joint motions; the type drives the operating design, the tier drives the investment level.

Forecastable is a partnerships operating platform; the tools above (Crossbeam, Pocus, Common Room, Tackle, Labra, Suger, Clazar, Introw, Euler, Impartner, PartnerStack, Channelscaler) are independent third-party platforms, and naming them is not an endorsement of any specific deployment over another. Evaluate each on your own motion.

Frequently asked questions

How many tiers should a partner ecosystem map have?
Three. Tier 1 (strategic, dedicated partner manager), Tier 2 (managed, shared partner manager), Tier 3 (transactional, self-serve). A fourth tier is rarely justified.

What are the partner-type categories on the map?
SI, ISV, reseller, marketplace, agency, alliance. Each category has a different operating motion and a different joint design.

Who owns the partner ecosystem map?
The head of partnerships owns the map; partnerships RevOps maintains it; the CRO co-owns the quarterly investment review. The map is not a marketing artifact.

How often should the partner ecosystem map be refreshed?
Quarterly, in alignment with the executive partner business review and the headcount and MDF reallocation cycle.

Where does the partner ecosystem map live?
In the PRM (Introw, Euler, Impartner, PartnerStack, or Channelscaler) as structured fields on the partner profile, with a BI rollup (Looker, Mode, Sigma) for the executive review. A slide version is the read-out; the data lives in the PRM.

Should we sunset Tier 3 partners on the ecosystem map?
Yes, on a defined cadence. A Tier 3 partner that has not produced a registered deal in two quarters should sunset; the sunset reclaims partnerships time for higher-conviction partners.

How does the partner ecosystem map relate to partner attribution?
The map drives the investment decisions; the attribution model produces the credit on closed deals. The two are different artifacts; the map informs which partners get the investment, the attribution model produces the score on which ones produce.

Next step

If a partner ecosystem map is open this quarter, the move this week is to draft the three-tier and six-type classification, run it against the current partner roster, and schedule the first quarterly investment review with the CRO and head of partnerships.

Start your growth journey now to install a working partner ecosystem map in your specific environment, or read the orientation on account mapping for the broader data layer that feeds it.

Uncover Your Growth Potential

Whether starting with a single sales team or a single partner, any co-sell motion can be live within 30 days.

Schedule a Discovery Call
Latest Insights
A partner manager and a sales rep reviewing a partner overlap map on a wall monitor showing shared and net-new accounts highlighted between two company logos, a printed shared-account list on the table, deep navy and warm amber palette
  • Account Mapping
Alex Buckles

Partner Overlap: Finding the Accounts You Share

What is partner overlap? Short answer: Partner overlap is the set of accounts that both you and a partner are working, have closed, or are prospecting at the same time, surfaced by comparing the two companies’ account lists. It is the raw material of co-sell, because the accounts you share are the ones where a […]

Read Article
A revenue operations leader and a partner manager at a desk reviewing a partner discovery data signal taxonomy on a wall monitor with overlap accounts tiered by signal strength alongside a printed partner-side context cheat sheet, deep navy and warm amber palette
  • Account Mapping
Alex Buckles

Partner Discovery Data: Building a Working Signal Layer

What is partner discovery data? Short answer: Partner discovery data is the structured intelligence layer that converts raw partner-side signal (account overlap, customer status, buying-committee relationships, deal-in-progress flags) into AE-ready signal with named tiers, partner-side context, and a defined next move per signal. It exists because raw overlap data is not signal, and AEs working […]

Read Article
Partner ops analyst and a sales operations leader at twin monitors reviewing a shared customer overlap report with named accounts and partner-warm tags highlighted, deep navy and amber palette
  • Account Mapping
Alex Buckles

Overlap Data: What It Is and How to Use It in 2026

What is overlap data? Short answer: overlap data is the structured comparison of two partners’ account lists, typically customers, prospects, and open opportunities, that produces a list of shared accounts and the metadata attached to each. It is the input to account mapping motions, ecosystem-data platforms, and modern co-sell programs. In 2026, most partnerships teams […]

Read Article
Partner manager and an AE in a Monday deal review with a printed prioritized account list and CRM screen showing partner-warm tags, deep navy and amber palette
  • Account Mapping
Alex Buckles

Partner Account Mapping: A 2026 Operating Guide

What is partner account mapping? Short answer: partner account mapping is the operating practice of comparing your account list to a partner’s account list, segmenting the results, prioritizing the segments by relationship depth and in-market signal, and routing the prioritized accounts into the seller’s weekly workflow. It is the operating motion that turns overlap data […]

Read Article
Logo โ€” Itโ€™s All AboutThe Team

Quick Links

  • Who We Serve
  • Solutions
  • Resources
  • Pricing
  • Our History

Social Media

  • Linkedin

Legal

  • Privacy Policy
  • Terms of Service
Quick Links
  • Who We Serve
  • Solutions
  • Resources
  • Pricing
  • Our History
Social Media
  • Linkedin
Legal
  • Privacy Policy
  • Terms of Service

Stay ahead on ecosystem-led growth

Logo โ€” Itโ€™s All AboutThe Team
ยฉ 2025 Forecastable. All rights reserved.
Book Your Strategy Call
Request Enrollment Details

[contact-form-7 id=”dfbeed3″ title=”Request Enrollment Details”]

Mollie Bodensteiner

Revops Advisory
  Mollie Bodensteiner is an experienced operations professional with a demonstrated track record of utilizing technology to support operational processes that drive performance and innovation. She currently is the Vice President of Operations at Sound and owns go-to-market agency, MB Solutions. Mollie has previously held operations leadership roles at Deel, Syncari, Corteva and Marketo. She has over 14 years of experience in both B2C and B2B operations and technology. When she is not working, Mollie enjoys spending time with her husband, three small children, and two large dogs. Childhood Career/Dream: Growing up in the age of Disney and Nick@Nite I always wanted to be a child actor (good thing that never was actually pursued ๐Ÿ™‚ Favorite Win: I am not sure I have a specific โ€œwinโ€ but I think I get the most joy and excitement from coaching others and watching them hit major milestones in their career. The first time you get to promote someone on your team or watch them lead a major project – are always career highlights! Personal Fun Facts: Favorite Song: If itโ€™s love, Train Favorite Movie: Good Will Hunting Favorite Meme: Disaster Girl
Forecastable resources: Co-Sell Orchestration Platform · All Use Cases · Live in 30 Days · Co-Sell Playbook

Kelsey Buckles

Director of Operations


My journey from Education to Operations has equipped me with a unique perspective and skill set that perfectly aligns with Forecastable’s mission to help businesses improve sales collaboration through partner co-selling strategies.

At Forecastable, I am passionate about empowering teams and organizations to unlock the full potential of strategic partnerships. By leveraging my expertise in communication, leadership, and operational efficiency, I contribute to creating seamless co-selling processes that align with business goals and deliver exceptional results.

The intersection of my educational foundation and operational experience fuels my dedication to fostering alignment, building trust, and enhancing collaboration between partners. I am driven by the opportunity to contribute to a platform that not only optimizes sales strategies but also strengthens relationships that lead to long-term growth.

Paul Jonhson

Chief Technology Officer (Co-founder)


Paul Johnson has 20+ years of software development and consulting experience for a variety of organizations, ranging from startups to large-enterprise organization with highly-complex needs.

Mr. Johnson has a long track record of successful technology deployments.
This, combined with his deep passion for machine learning and exceptional user experience design, allows him to lead our technical direction from the front with confidence.

Alex Buckles

Product, Partnerships, and Value Engineering (Co-founder)


After serving in The United States Marine Corps, Alex Buckles spent the next two decades as a student of revenue production and an advocate for innovation.

Along the way, he has helped numerous companies achieve double and triple-digit growth by crafting and executing high-performing go-to-market strategies, with co-selling at the center of each.

As a once-advanced technical marketer, an expert sales & partner professional, and a strong customer success advocate, Mr. Buckles understands the impact of these functions aligning not only on revenue production, but on the day-to-day execution of the go-to-market strategy. This concept of revenue-team alignment is what quickly became the foundation of Forecastable back in January of 2018.

In his free time, youโ€™ll find him spending quality time with his children, one of whom is on the autism spectrum. 1 in 36 children in the U.S. are on the spectrum and boys are four times more likely to be diagnosed than girls.

With that in mind, Mr. Buckles plans on dedicating the rest of his life serving those living with autism, through his organization Pathways for Autism. From his perspective, there must be a scalable and financially self-sustaining infrastructure established to put as many individuals with autism as possible on a path towards complete independence as adults.