Sales Pipeline Reporting: Reports That Predict Revenue

Short answer
Short answer: Sales pipeline reporting is the practice of measuring the open opportunities in your funnel by stage, value, age, and conversion so a leader can see what will close and what is stuck. Done well, it reads pipeline by source too, because where a deal came from predicts how it behaves better than any stage label.
Here is the position. Most pipeline reports answer how much and what stage, and almost none answer where it came from. That missing column is where the warmest, highest-converting channel hides, and it is almost always the partner channel.
What is sales pipeline reporting?
Sales pipeline reporting is the set of views a revenue team uses to understand its open opportunities: total value, count by stage, average deal size, win rate, sales-cycle length, and the movement of deals between stages over time. It is the operating picture a sales leader uses to forecast and to decide where to spend attention this quarter.
A good report does three jobs. It shows the current state of the funnel, it shows the flow through the funnel, and it shows the quality of what is in the funnel. Most teams get the first job right, approximate the second, and skip the third. Quality is where source belongs, because a deal sourced by a trusted partner is not the same asset as a cold-outbound deal sitting at the identical stage.
Why sales pipeline reporting matters in 2026
Sales pipeline reporting matters because boards stopped accepting a single pipeline number and started asking what is behind it. Coverage ratios that looked healthy produced misses, and the reason was almost always that the pipeline was real in volume and weak in quality. A report that cannot show quality cannot explain the miss.
The second reason is cost. Every channel feeding the pipeline has a different cost to produce and a different conversion rate, and a report that pools them hides which dollar worked. When budgets tighten, the first question is which source returns the most pipeline per dollar, and a stage-only report cannot answer it.
In my work with revenue teams, the pattern repeats: the forecast misses, everyone blames the reps, and the real problem is that the report never separated the warm deals from the cold ones, so a weak quarter of cold pipeline looked identical to a strong quarter of warm pipeline until it was too late to act.
How sales pipeline reporting actually works
Sales pipeline reporting works as a stack of views, where each layer answers a different leadership question and the bottom layer, source, is the one most reports omit.
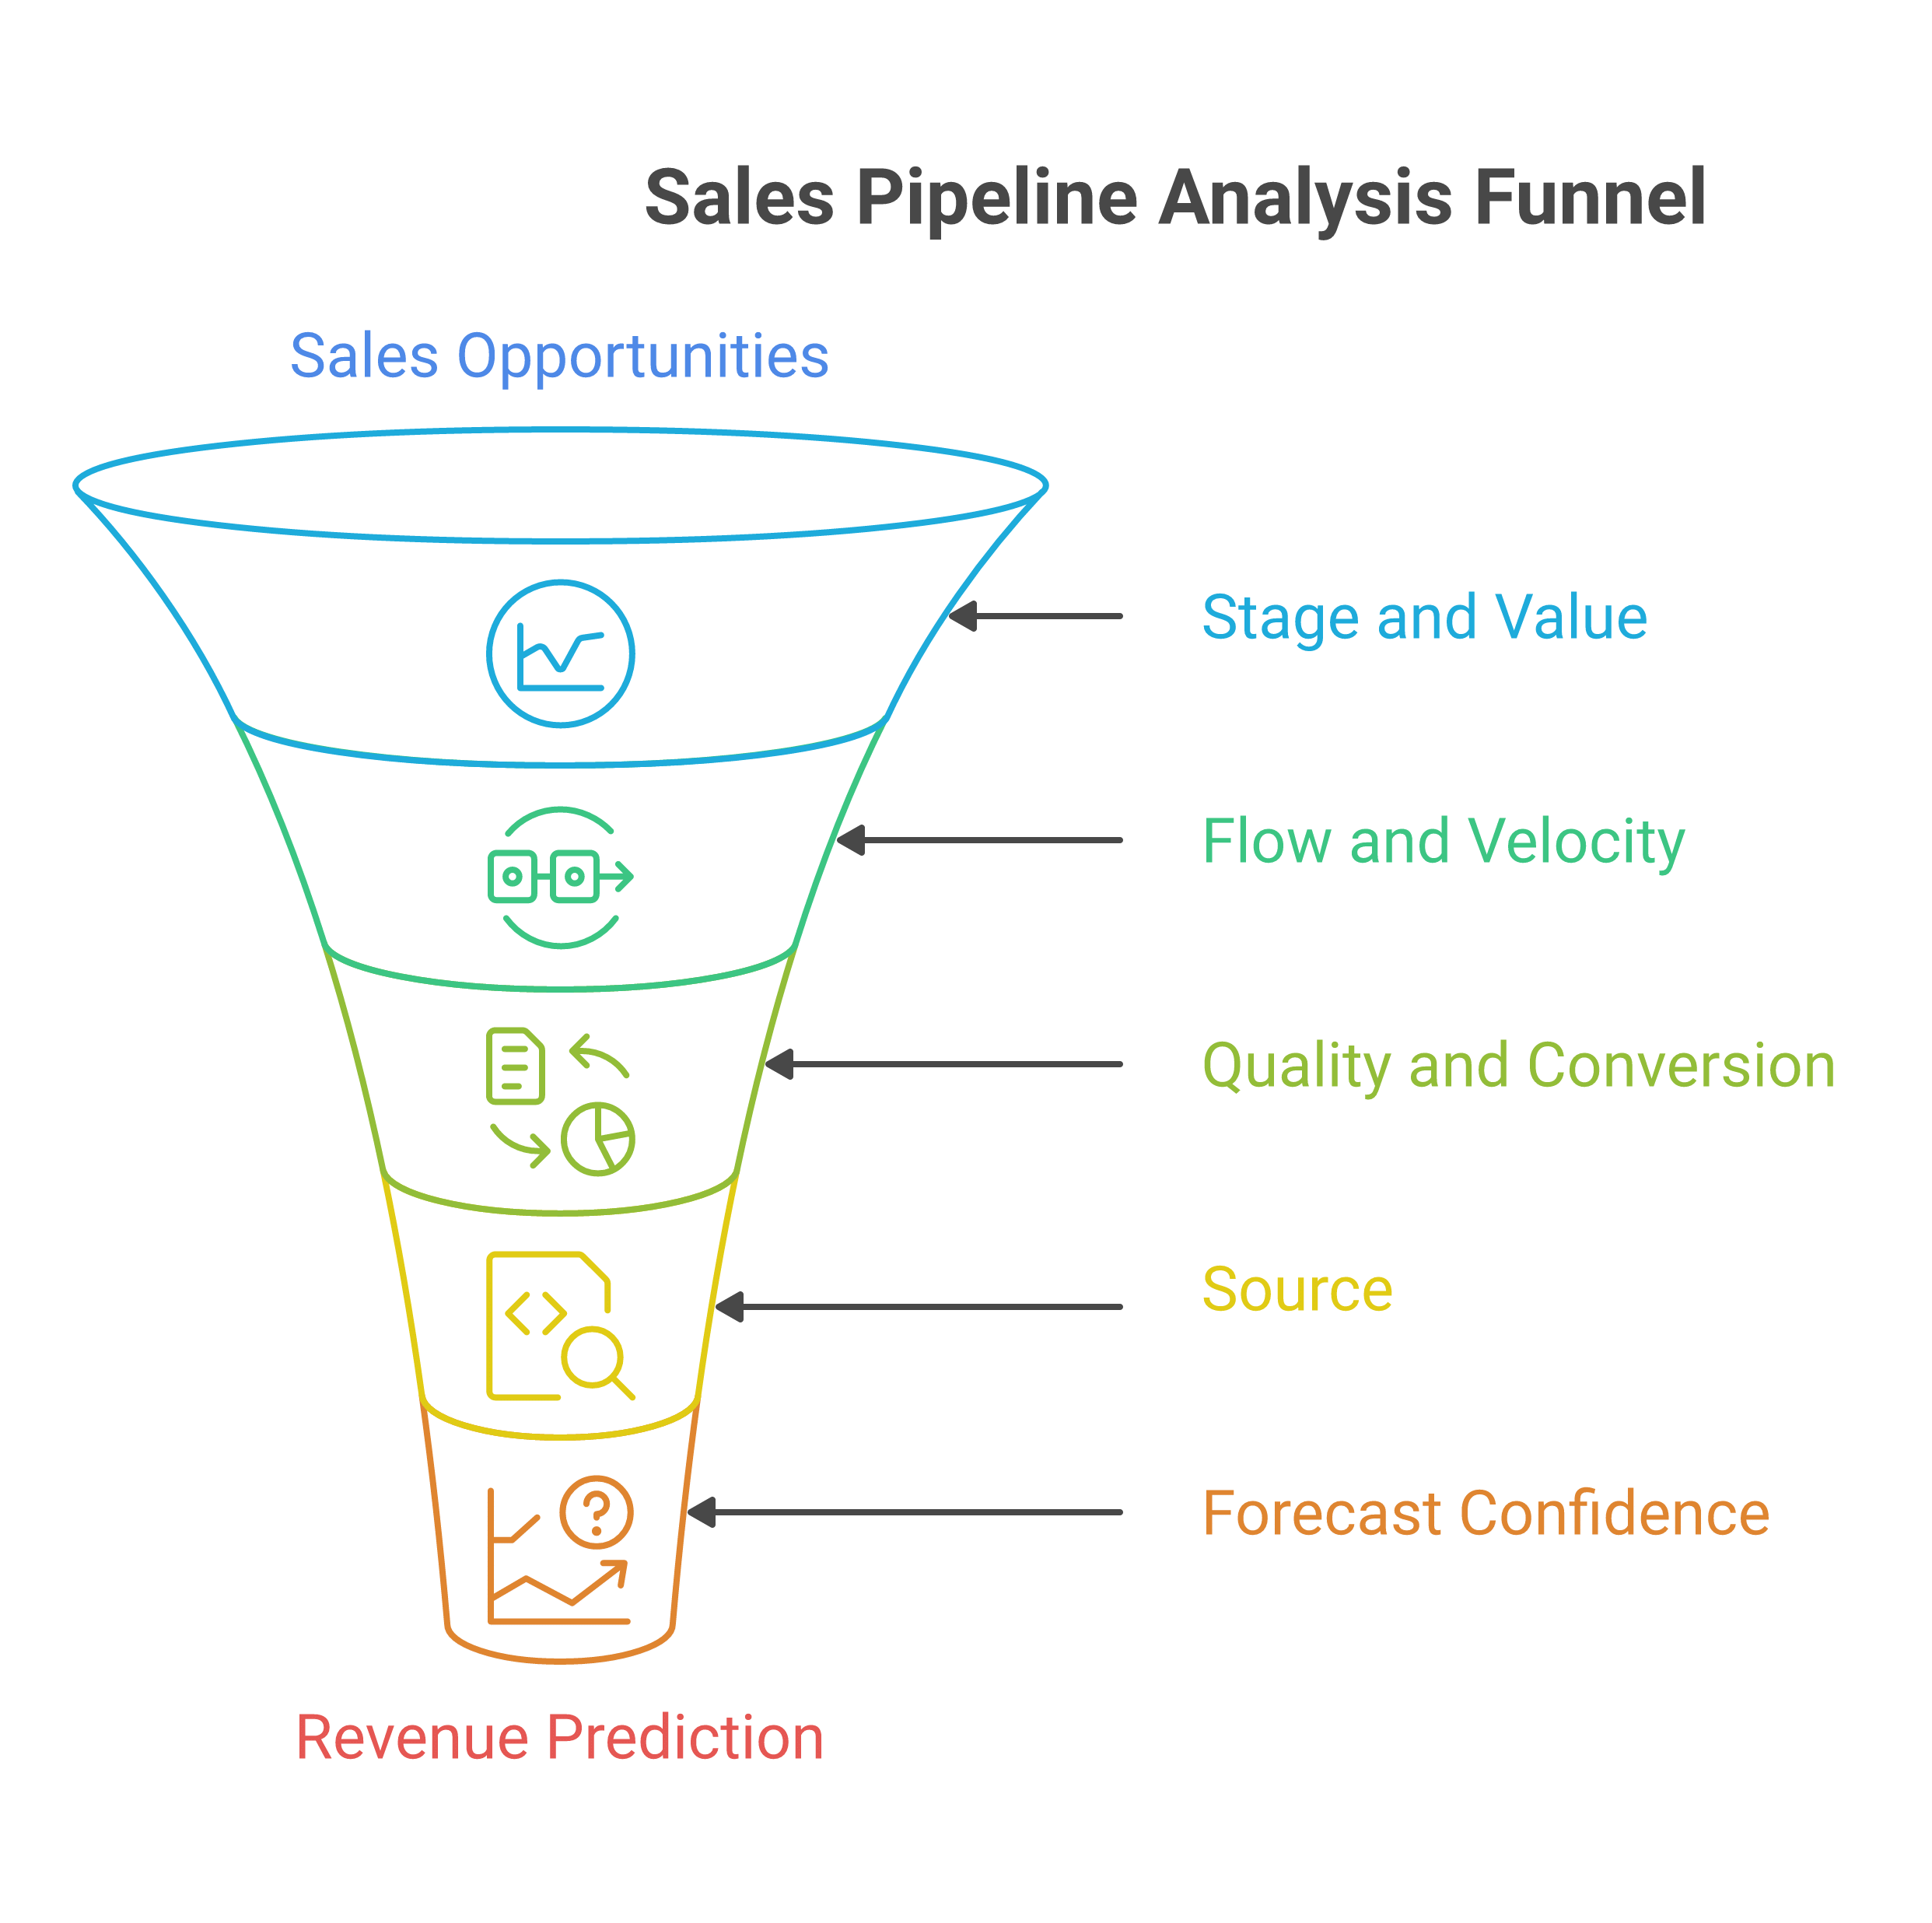
- Stage and value view: report open pipeline by stage and dollar value as the baseline, but treat it as a starting point, because two funnels with identical stage distributions can forecast completely differently.
- Flow and velocity view: measure how deals move between stages and how long they sit, since stalled deals inflate the total without ever converting and velocity is the earliest warning the quarter is slipping.
- Quality and conversion view: score pipeline by historical conversion at each stage, because a report that weights a stage-2 deal the same whether it converts at 8 percent or 40 percent is telling the leader a comforting lie.
- Source view: split every number above by where the deal originated, inbound, outbound, and partner-sourced, because source is the strongest predictor of conversion and the column that exposes which channel actually funds the forecast.
- Forecast confidence view: roll the source-weighted, conversion-weighted pipeline into a commit, best-case, and worst-case band, so the number a leader takes to the board carries the quality behind it, not just the sum.
The through-line is that each layer should feed the next. A total without flow is a snapshot, flow without quality is motion without meaning, and quality without source cannot tell you where to spend the next dollar.
Common pitfalls
- Reporting volume as health: presenting total open pipeline as if a bigger number were a better number, which rewards reps for stuffing the funnel with deals that will never convert.
- No source column: pooling inbound, outbound, and partner-sourced into one total, so the warmest, cheapest channel is invisible and keeps getting underfunded.
- Stage labels without conversion weights: treating every stage-3 deal as equal when historical conversion varies several-fold by source, which produces a forecast that feels precise and misses badly.
- Ignoring velocity: reporting the total without reporting age, so a pile of stalled deals keeps the coverage ratio looking safe while nothing moves.
- Crediting the last touch: logging the rep who booked the next meeting as the source, which quietly erases the partner introduction that actually started the deal and corrupts every source number downstream.
What this looks like in practice
A CRO reviews a healthy-looking pipeline: coverage is three times quota, stage distribution looks normal, the total is up quarter over quarter. Then the RevOps lead adds one column, source, and the picture changes. Cold outbound makes up 60 percent of the pipeline and converts at 6 percent. Partner-sourced deals make up 15 percent of the pipeline and convert at 34 percent, because a partner introduction arrives with trust a sequence cannot manufacture. The stage-only report had been treating those two kinds of deals as interchangeable.
The decision changes immediately. The weighted forecast, once source is applied, is lower than the raw number and more accurate. And the resource question answers itself: the channel producing a third of the conversions on a sixth of the volume is the one to feed, not the one the dashboard had been quietly starving.
Forecastable’s POV
Pipeline reporting goes wrong at the quality layer, and the single most valuable quality signal is source. I have watched teams invest in elaborate stage definitions and conversion models while leaving every deal tagged with the rep who logged the last activity, which means the source data is fiction and every report built on it inherits the fiction.
Partner-sourced pipeline is the clearest case. It is usually the warmest and the highest-converting pipeline a company has, and it is the worst-measured, because the partner introduction gets absorbed into a rep’s number the moment the rep books the follow-up. At Forecastable we are a partnerships operating platform that connects partner conversations and actions to CRM pipeline and revenue, so a partner-sourced deal stays tagged to its real origin and shows up in the same pipeline report as everything else, measured the same way.
My bet: the teams that add a source column to every pipeline view, and defend it against last-touch overwrites, are the ones whose forecasts stop surprising them.
Forecastable is an independent third-party. Any tools, vendors, or third-party figures referenced here are described from public information for the reader’s own evaluation, not as paid placements.
Frequently asked questions
What should a sales pipeline report include? Open pipeline by stage and value, flow and velocity between stages, conversion-weighted quality, a source split, and a forecast confidence band. The source split and the conversion weighting are the two most teams omit and the two that most improve forecast accuracy.
How often should pipeline reporting run? The core report should update continuously from the CRM and be reviewed weekly with the sales team and at least monthly with leadership. The point of a live report is that velocity and stalled-deal problems surface while there is still time to act on them.
What is the difference between pipeline reporting and forecasting? Pipeline reporting describes the open opportunities you have today. Forecasting applies conversion probability to that pipeline to predict what will close in a period. A forecast is only as good as the quality and source data in the report beneath it.
Why report pipeline by source? Because source predicts conversion better than stage. Partner-sourced and inbound deals usually convert several times higher than cold outbound at the same stage, so a report that pools them misstates both the forecast and which channel deserves the next dollar.
What pipeline metrics predict revenue best? Conversion-weighted pipeline value by source, sales-cycle velocity, and win rate by source. Raw open-pipeline totals predict revenue poorly because they treat a stalled cold deal and a moving warm deal as the same asset.
How does partner-sourced pipeline get lost in reporting? A partner makes the introduction, a rep books the next meeting, and the CRM credits the rep as the source. Without a system that preserves the partner origin, every downstream report undercounts the warmest channel the company has.
Next step
Add one column to your main pipeline report this week: source, split into inbound, outbound, and partner-sourced, and weight each by its real historical conversion. Then look at which channel produces the most conversions per dollar.
If the answer is the partner channel and your report cannot see it, that is the gap we close. Start your growth journey with Forecastable and we will put partner-sourced deals in the same pipeline report as everything else. Our B2B outbound sales guide covers the cold end of the funnel, and the partner attribution guide covers how to keep source data honest.
Uncover Your Growth Potential
Schedule a Discovery Call