Partner Onboarding Process Flow Chart (Template)

What is a partner onboarding process flow chart?
Short answer: A partner onboarding process flow chart is a visual map of the stages, owners, and decision points that move a newly signed partner from contract to first deal. It turns onboarding from a set of scattered tasks into a sequence anyone can see, follow, and improve, with a clear handoff at each step. The value is not the diagram itself but what it forces: an agreed path, an owner per stage, and a gate that says a partner is ready to advance.
Most onboarding fails quietly because no one can see the whole path. A flow chart makes the path visible, which is the first step to making it reliable.
Why a partner onboarding process flow chart matters in 2026
A partner onboarding process flow chart matters because onboarding is where most partners are won or lost, and a process you cannot see is a process you cannot fix. When onboarding lives in someone’s memory and a few email threads, partners fall through the gaps between steps, handoffs get dropped, and no one notices until the partner has gone quiet. A flow chart exposes the gaps so they can be closed.
In 2026, programs are onboarding more partners and cannot afford to do it by hand each time. A documented flow chart lets onboarding run the same way for every partner, with the same owners and the same gates, whether it is the tenth partner or the hundredth. It also gives leadership a way to see where partners stall, because a chart with stages is a chart you can measure. The alternative, ad hoc onboarding, does not scale and cannot be improved, because there is nothing consistent to improve.
How a partner onboarding process flow chart actually works
A partner onboarding process flow chart works by laying out onboarding as connected stages, each with an owner and a readiness gate, so a partner advances only when the prior step is genuinely complete. The chart reads left to right, from signed to first deal, and every arrow is a handoff someone owns. The stages below are what a working chart includes.
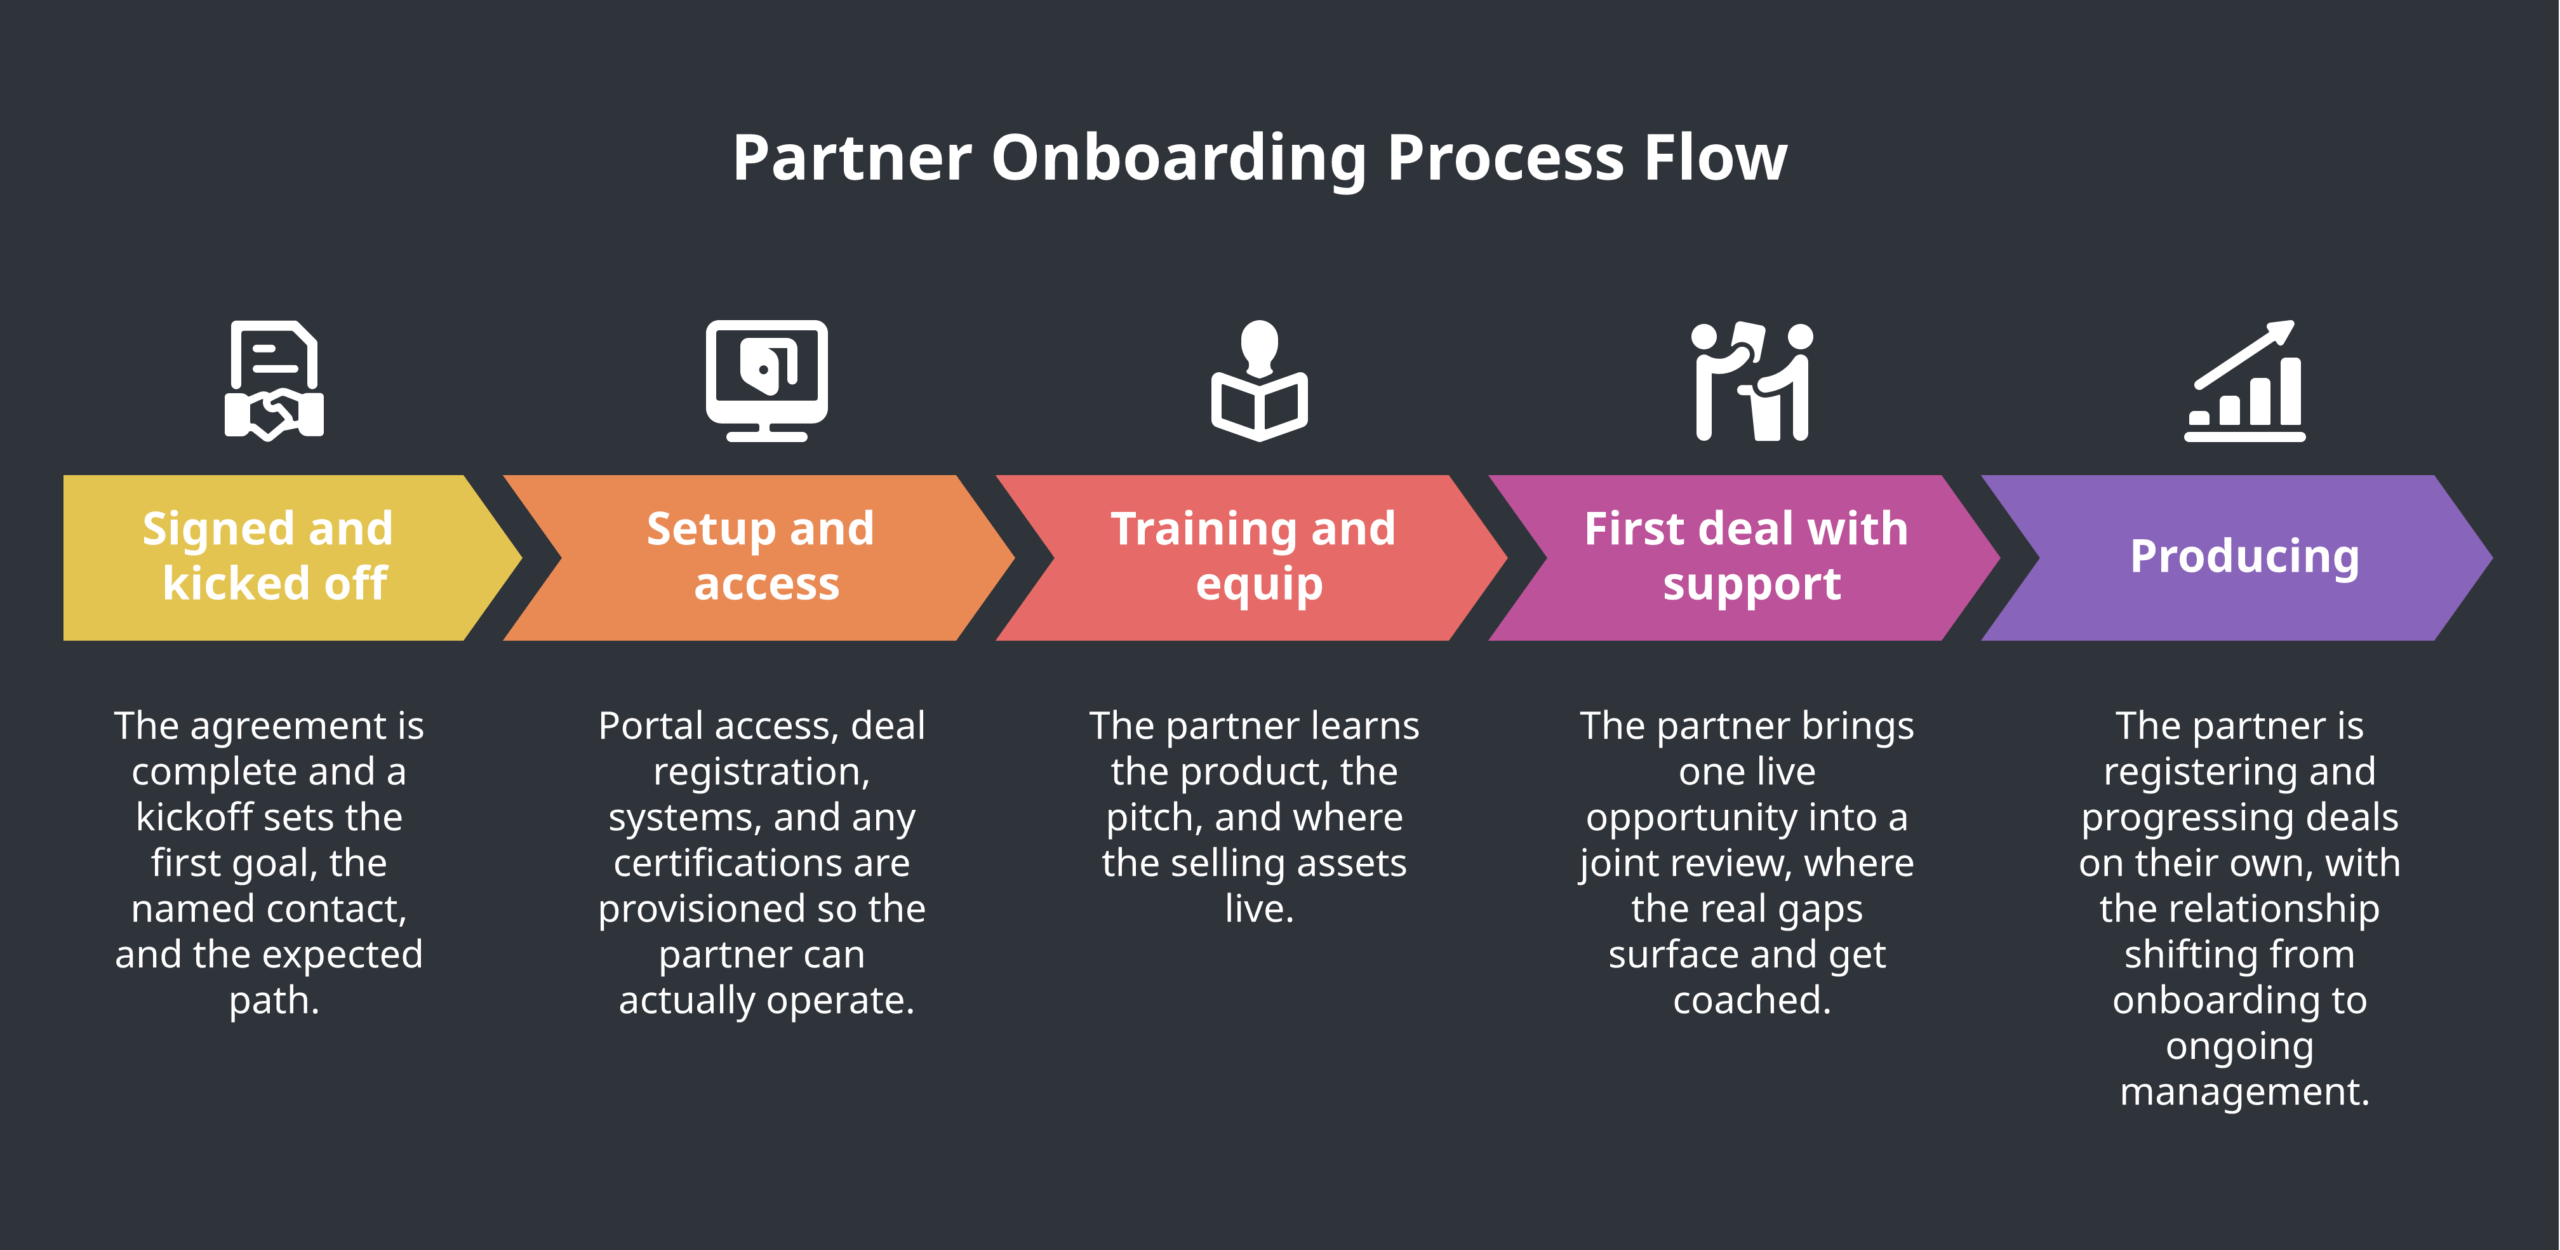
- Signed and kicked off: The agreement is complete and a kickoff sets the first goal, the named contact, and the expected path. Owner: partner manager. Gate: the partner knows what the first ninety days look like.
- Setup and access: Portal access, deal registration, systems, and any certifications are provisioned so the partner can actually operate. Owner: partner operations. Gate: the partner can log in and transact.
- Training and equip: The partner learns the product, the pitch, and where the selling assets live. Owner: enablement. Gate: the partner can run a credible first conversation without you.
- First deal with support: The partner brings one live opportunity into a joint review, where the real gaps surface and get coached. Owner: partner manager plus a sales contact. Gate: a genuine opportunity is in play.
- Producing: The partner is registering and progressing deals on their own, with the relationship shifting from onboarding to ongoing management. Owner: partner manager. Gate: first deal closed or clearly advancing.
A partner onboarding process flow chart template you can copy
Use this as the text version of the chart, then draw it as boxes and arrows. Each line is a stage, its owner, and the gate that lets the partner advance.
- Stage 1, Signed and kicked off (owner: partner manager) advances when the partner has a first goal, a named contact, and a ninety-day plan.
- Stage 2, Setup and access (owner: partner operations) advances when the partner can log in, register a deal, and transact.
- Stage 3, Training and equip (owner: enablement) advances when the partner can run a first pitch and find the selling assets.
- Stage 4, First deal with support (owner: partner manager plus sales) advances when one real opportunity is in a joint review.
- Stage 5, Producing (owner: partner manager) is reached when the first deal closes or is clearly progressing.
Add one decision diamond after Stage 4: if no genuine opportunity appears within the target window, the flow loops back to a coaching step rather than advancing, so a partner is never marked producing on paper while quiet in practice.
Common pitfalls in a partner onboarding process flow chart
- A chart with no owners: Stages without a named owner become no one’s job, and partners stall in the gaps between steps. Every stage needs one owner.
- Gates that are not enforced: If a partner advances without meeting the gate, the chart becomes decoration. The gate is the point; it is what keeps the process honest.
- Skipping the first-deal stage: Charts that end at training mark partners complete before they have sold anything, which is exactly where onboarding usually fails.
- A chart nobody runs: A flow chart drawn once and filed does not improve onboarding. It has to be the actual path every partner follows.
- No loop for stalled partners: Without a path back to coaching, a partner who does not produce is either stuck forever or quietly marked done. The decision diamond keeps them moving.
What this looks like in practice
A worked example: a vendor onboarded partners through a welcome email, a portal invite, and a certification link, and could not explain why most partners never produced. They mapped the actual onboarding as a flow chart and found there was no first-deal stage at all, partners were marked onboarded the moment they finished certification. They redrew the chart with five stages, an owner per stage, and a gate on each, and added the decision loop after the first-deal stage. The redraw itself surfaced two dropped handoffs, setup to training and training to first deal, that had been swallowing partners for a year. Once every partner ran the documented path, the share who reached a real first deal rose sharply, and the team could point to exactly which stage a stalled partner was stuck in. The lesson was that the chart did not add work; it made the existing work visible and accountable.
Forecastable’s POV on the partner onboarding process flow chart
Our position is that a partner onboarding process flow chart is valuable only to the extent its gates are enforced, and that most charts fail not because they are badly drawn but because partners are waved past the gates when the numbers need to look good. A chart with soft gates is a picture of a process, not a process. The discipline of holding the gate, especially the first-deal gate, is what turns the diagram into results.
We also think the chart should end at producing, not at trained, because everything before a first deal is preparation and the deal is the point. Programs that draw the chart to certification and stop are measuring readiness and calling it onboarding. Extending the chart to a real opportunity, with a loop back for partners who stall, keeps the process honest about what onboarding is for.
Forecastable is a partnerships operating platform focused on connecting partner conversations and actions to CRM pipeline and revenue. We do not draw your chart or run your portal. We make it visible where partners actually are in the path, so a stalled partner shows up as a stage to unblock rather than a name that quietly went dark, and so onboarding is measured by partners reaching a first deal.
Forecastable is a partnerships operating platform and a category authority, not a PRM vendor. Any third-party tools or firms referenced in this space are independent third-party products, and mentioning them is not an endorsement. Evaluate any onboarding flow against your own partner mix, motion, and CRM.
Frequently asked questions
What is a partner onboarding process flow chart?
A visual map of the stages, owners, and decision points that move a signed partner from contract to first deal, so onboarding is a visible, followable path rather than scattered tasks.
What stages belong on the chart?
Commonly signed and kicked off, setup and access, training and equip, first deal with support, and producing, each with an owner and a readiness gate.
Who owns each stage?
Typically the partner manager, partner operations, and enablement across the stages, with a sales contact joining for the first-deal review.
How detailed should the flow chart be?
Detailed enough to name an owner and a gate for each stage and to show the loop back for stalled partners, but simple enough that people actually follow it.
Where do partners usually stall?
At the handoffs between stages and at the first-deal stage, which is why the chart needs enforced gates and a loop back to coaching.
How do you use the chart to improve onboarding?
By tracking where partners stall against the stages and fixing the specific handoff or gate that leaks, rather than reworking the whole program.
Next step
If partners go quiet after signing, draw your onboarding as a flow chart, put an owner and a gate on every stage, and extend it to a real first deal. Use the template above as your starting point. Start your growth journey now to make where partners stand in onboarding visible in the forecast. The partner program hub frames how the partner onboarding process flow chart connects to recruitment, enablement, and co-selling.
Uncover Your Growth Potential
Schedule a Discovery Call