Partner Performance Metrics That Predict Revenue

Short answer
Short answer: Partner performance metrics are the measures you use to judge whether a partner is producing revenue, from partner-sourced pipeline to activation rate to win rate on partner-involved deals. They matter because most programs track activity, like signed partners and portal logins, and mistake motion for production.
Here is the distinction that decides everything. A metric either predicts revenue or it describes activity. Almost every partner dashboard I audit is full of the second kind and starved of the first.
What are partner performance metrics?
Partner performance metrics are the specific, defensible numbers that tell you which partners are worth more of your team’s attention and which are not. Good ones connect a partner’s actions to pipeline and revenue you can trace. Weak ones count things that feel like progress, such as how many partners you signed or how many logged into the portal this month, without connecting to a single closed deal.
The reason this matters is that partner-manager attention is finite, and the metrics you choose decide where it goes. Measure signed partners and you will optimize for recruiting. Measure sourced pipeline per partner and you will optimize for production. The dashboard is not a passive report; it is the thing that quietly sets your team’s priorities.
The confusion I run into is that teams believe more metrics equal more rigor. The opposite is true. A program that tracks five numbers that predict revenue is in far better shape than one that tracks thirty that describe activity. The discipline is choosing the few that matter and refusing to be impressed by the rest.
Why partner performance metrics matter in 2026
Partner performance metrics matter more now because partner-involved deals have become the majority of the pipeline, and finance has noticed. Crossbeam has reported that partner-involved deals win at higher rates and run larger than solo deals, which means the partner motion is now a material line in the forecast. A material line gets scrutinized, and a program that cannot show sourced revenue per partner loses that argument in the room.
The second reason is that revenue teams are consolidating and every function has to defend its headcount with numbers. A partnerships leader who can point to sourced pipeline per partner and a rising activation rate has a budget conversation. A leader who can only show a growing roster of signed partners has a cost center. The metrics are the difference between the two.
The catch is that the right metrics are harder to produce than the wrong ones. Signed-partner counts come free from the portal. Sourced pipeline per partner requires clean attribution, an agreed definition of sourced versus influenced, and a way to see partner involvement inside CRM. The effort is the reason so many programs default to the easy, useless numbers.
How a partner performance metrics system actually works
A useful partner-metrics system runs on five measures. The first two are the revenue metrics that matter most, and the last three tell you whether the pipeline metrics will hold up next quarter.
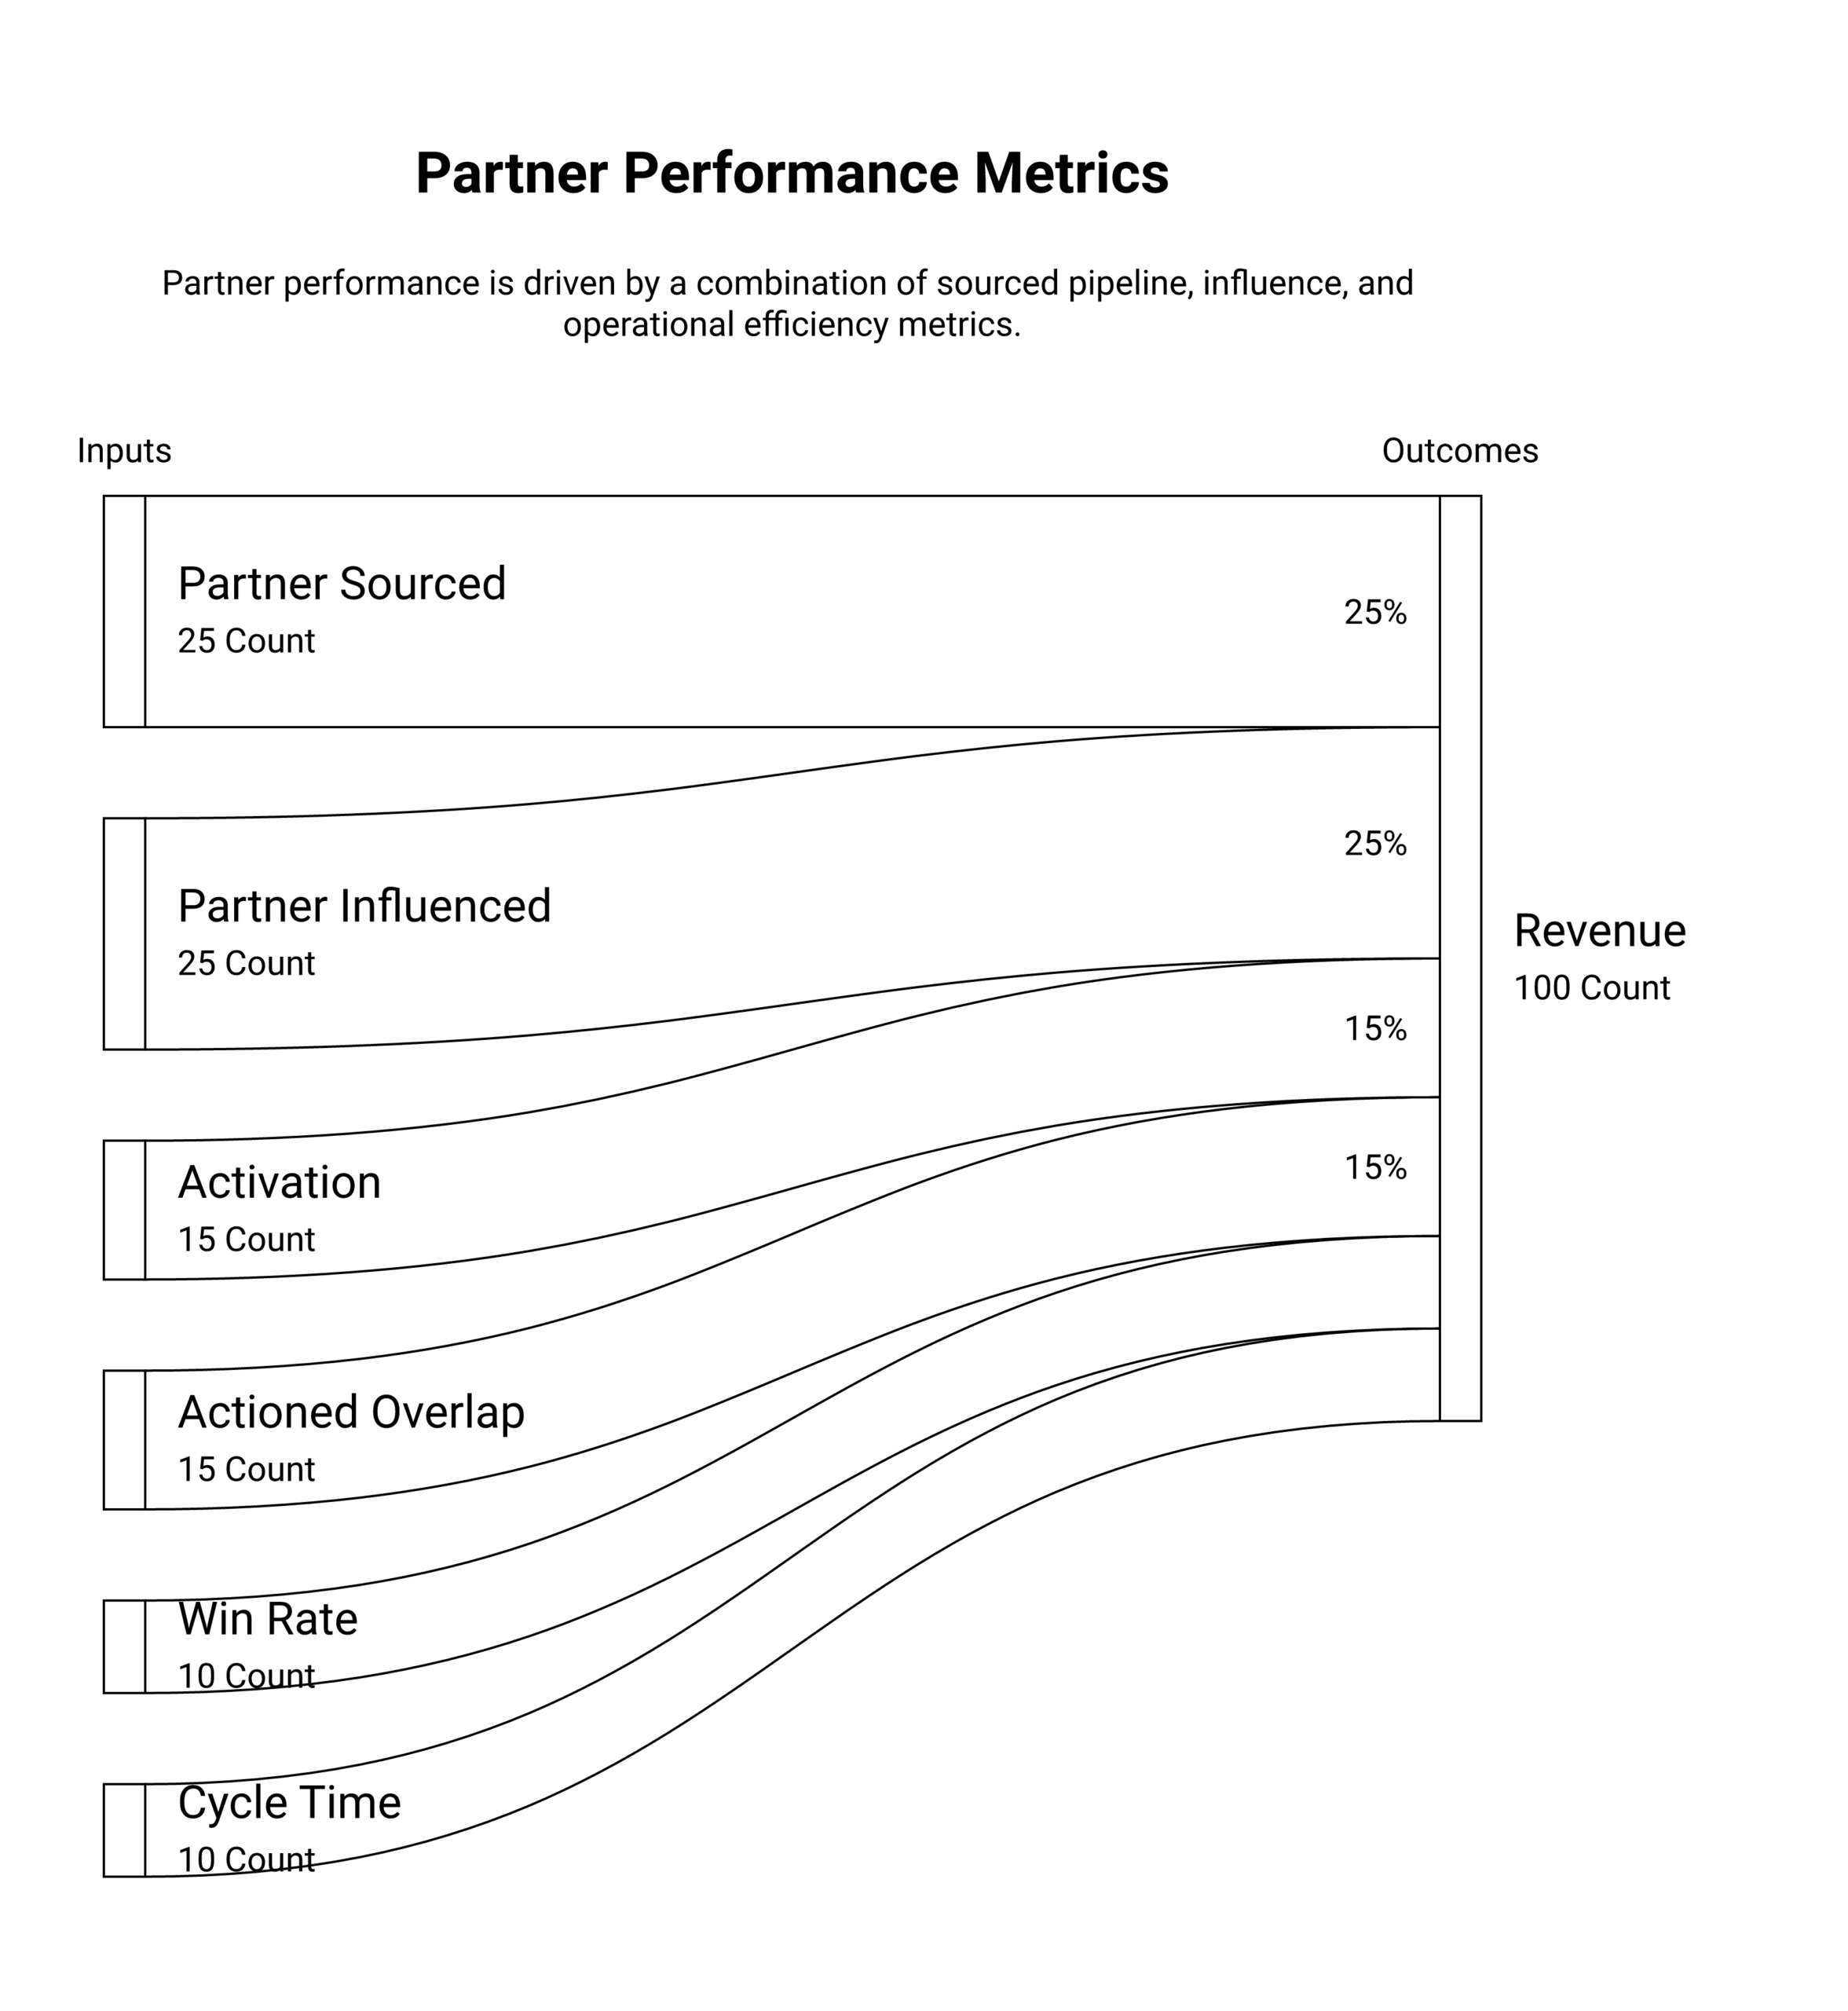
- Partner-sourced pipeline: opportunities a partner opened that did not exist for you before, measured per partner. Sourced means a new deal, and this is the single most important partner metric because it is the one finance treats as real channel contribution.
- Partner-influenced pipeline: deals a partner helped on that you already had open, measured separately. Influenced revenue is valuable for velocity and win rate, but conflating it with sourced inflates the channel and starts attribution fights, so keep the two explicit.
- Activation rate: the share of signed partners that have actually run a deal in the period. A low activation rate is the clearest sign that a program is recruiting faster than it is activating, and it predicts a pipeline problem before the pipeline shows it.
- Actioned-overlap rate: of the shared accounts your overlap data surfaces, how many were actually worked. This is the leading indicator of sourced pipeline, because unworked overlap is potential revenue sitting idle.
- Win rate and cycle time on partner deals: how partner-involved deals compare to solo deals on close rate and speed. This is what justifies the whole motion to a CRO, and it is the metric that turns partnerships from a relationship function into a revenue one.
The through-line is that revenue metrics tell you what happened and leading metrics tell you what is about to. A program that watches both can act before the quarter is decided instead of explaining it afterward.
Common pitfalls
- Counting signed partners as performance: treating roster growth as a health metric when it is a recruiting metric. A bigger roster with a flat activation rate is a warning, not a win.
- Conflating sourced and influenced: reporting one blended partner-revenue number, which inflates the channel and triggers attribution disputes with direct reps the moment a deal is contested.
- Measuring activity as a proxy for production: reporting portal logins, meetings held, and deal registrations that never close, all of which are easy to generate and none of which predict revenue.
- No agreed definition of sourced: letting each partner manager decide what counts, so the numbers cannot be compared across partners or trusted by finance.
- Watching only lagging metrics: reporting closed partner revenue with no leading indicators, so you learn the pipeline was thin only after it is too late to fix.
Tools and examples
The data behind partner metrics comes from your CRM plus an ecosystem and account-mapping layer that shows where partners overlap your accounts and where they are involved in deals. These tools supply the raw signal; the definitions and the discipline are yours.
| Tool | What it does | Best for |
|---|---|---|
| Crossbeam | Secure account mapping and overlap data across a partner network, with alerts when overlap or deal status changes | The broadest partner network and the default source of partner-involvement signal |
| Pocus | Blends product and ecosystem signals to score accounts and surface where partners can move a deal | Teams that want partner signal fused with usage and intent data for prioritization |
| Common Room | Aggregates ecosystem, community, and intent signals into account and person views | Teams already running signal-based prioritization who want partner involvement in the same place |
A worked example makes the point. Say a partnerships leader reports 60 signed partners and a big partner-revenue number to the board and gets pushed on it. The wrong response is to add more logos. The right response, the one I coach, is to split the number: sourced versus influenced, per partner. That split usually shows a handful of partners sourcing real new pipeline and the rest riding influenced credit on deals the direct team already had. From there the leader can show sourced pipeline per partner, a rising activation rate, and a win-rate lift on partner deals, which is a forecast the CRO can defend instead of a roster the CFO will question.
Forecastable’s POV
Partner performance measurement is where good programs quietly lose the plot. The instinct is to prove the program is busy, so the dashboard fills with activity: partners signed, portals logged into, meetings booked. All of it is easy to produce and none of it survives contact with a CFO who asks a simple question, which is how much new pipeline the channel actually sourced.
The win in partner metrics is not a fuller dashboard. It is the discipline to measure the few numbers that predict revenue, keep sourced and influenced explicit, and watch the leading indicators, activation rate and actioned-overlap, so you can act before the quarter closes. That is an attribution and accountability problem, and it is human work supported by software, not a report that writes itself.
At Forecastable we build for exactly that. We are a partnerships operating platform focused on connecting partner conversations and actions to CRM pipeline and revenue, the flywheel that runs from conversations to actions to pipeline to revenue. The platform captures partner involvement and attribution inside CRM, and the Co-Sell Alignment Specialist, delivered as part of the service, uses it to run the cadence and report sourced pipeline per partner in the language a CRO and a CFO already speak.
My bet: the programs that survive the next budget cycle will be the ones whose metrics predict revenue, not the ones whose metrics describe effort.
Forecastable is an independent third-party. Any tools or vendors named here are described from public information for the reader’s own evaluation, not as paid placements, and Forecastable does not resell them.
Frequently asked questions
What are partner performance metrics? Partner performance metrics are the numbers that judge whether a partner produces revenue, including partner-sourced pipeline, partner-influenced pipeline, activation rate, actioned-overlap rate, and win rate on partner deals. The useful ones connect a partner’s actions to traceable pipeline.
What is the difference between partner-sourced and partner-influenced pipeline? Partner-sourced pipeline is a new opportunity the partner opened that did not exist for you before. Partner-influenced pipeline is a deal the partner helped on that you already had open. Keeping them separate prevents inflated channel numbers and attribution disputes.
What is a good partner activation rate? The right benchmark is your own trend, but the principle is firm: a low or falling activation rate means you are signing partners faster than you are activating them. Activation rate predicts a pipeline problem before the pipeline reveals it.
Which partner metrics should I stop tracking? Stop treating signed-partner counts, portal logins, and meetings held as performance. They are activity, not production, and optimizing for them grows the roster without growing the pipeline.
How do you measure partner performance without clean attribution? You start by agreeing what counts as sourced versus influenced, then capture partner involvement inside CRM so it can be traced. Overlap and ecosystem tools supply the signal, but the definitions and the discipline to apply them consistently are what make the numbers trustworthy.
Next step
Pull your partner-revenue number and split it in two: sourced and influenced, per partner. If most of it turns out to be influenced credit on deals the direct team already had, you have found the gap between how the program looks and what it produces.
If you want partner performance measured as sourced pipeline you can defend to finance, that is what we do. Start your growth journey with Forecastable and we will turn the dashboard into a forecast. Our account mapping guide covers how the overlap data feeds these metrics.
Uncover Your Growth Potential
Schedule a Discovery Call