Sales Pipeline KPIs: The Ones Your Board Should See

Short answer
Short answer: Sales pipeline KPIs are the measured targets a revenue team commits to and tracks against to know whether the pipeline will deliver, from coverage and conversion to velocity and win rate. The difference between a KPI and a metric is accountability: a metric is a number you watch, and a KPI is a number with a threshold someone owns, which is why a dashboard of thirty metrics usually hides the five KPIs that matter.
Here is the position. A board does not need more numbers, it needs fewer numbers with targets attached and an owner for each. The KPIs worth that status are the ones that change a decision when they move.
What are sales pipeline KPIs?
Sales pipeline KPIs are the key performance indicators a team uses to manage the pipeline toward a forecast. They are a deliberate subset of all the things you could measure, chosen because each one carries a target, an owner, and a decision that changes when the number crosses its threshold.
That distinction is the whole point. You can measure dozens of things about a pipeline, but a KPI is a measure you are accountable to. Coverage is a KPI when you set a target ratio and act when it drops below. Stage conversion is a KPI when a fall in it triggers a review rather than a shrug. A number with no threshold and no owner is a metric on a dashboard, and dashboards full of those are how teams end up data-rich and decision-poor.
Why sales pipeline KPIs matter in 2026
Sales pipeline KPIs matter because forecast credibility is under pressure and boards have stopped accepting a confident number that misses. When a quarter slips, the next question is which KPI was off and who owned it, and teams that cannot answer that lose the room. In 2026 the expectation is a small, owned set of pipeline KPIs with targets, reviewed on a cadence, not a sprawling dashboard nobody acts on.
The other force is signal-to-noise. Modern CRMs and dashboards can display everything, which means the few numbers that predict the quarter drown in the many that merely describe it. The skill now is subtraction: choosing the handful of KPIs that actually move a decision and cutting the rest, so the review is about action rather than admiration.
In my work with revenue teams, the most common KPI failure is a dashboard with twenty green tiles sitting on top of a pipeline that will miss, because none of the tiles was a conversion KPI with a real threshold and an owner.
How sales pipeline KPIs actually work
Sales pipeline KPIs work as a tight set, where each one carries a threshold and together they answer whether the quarter lands.
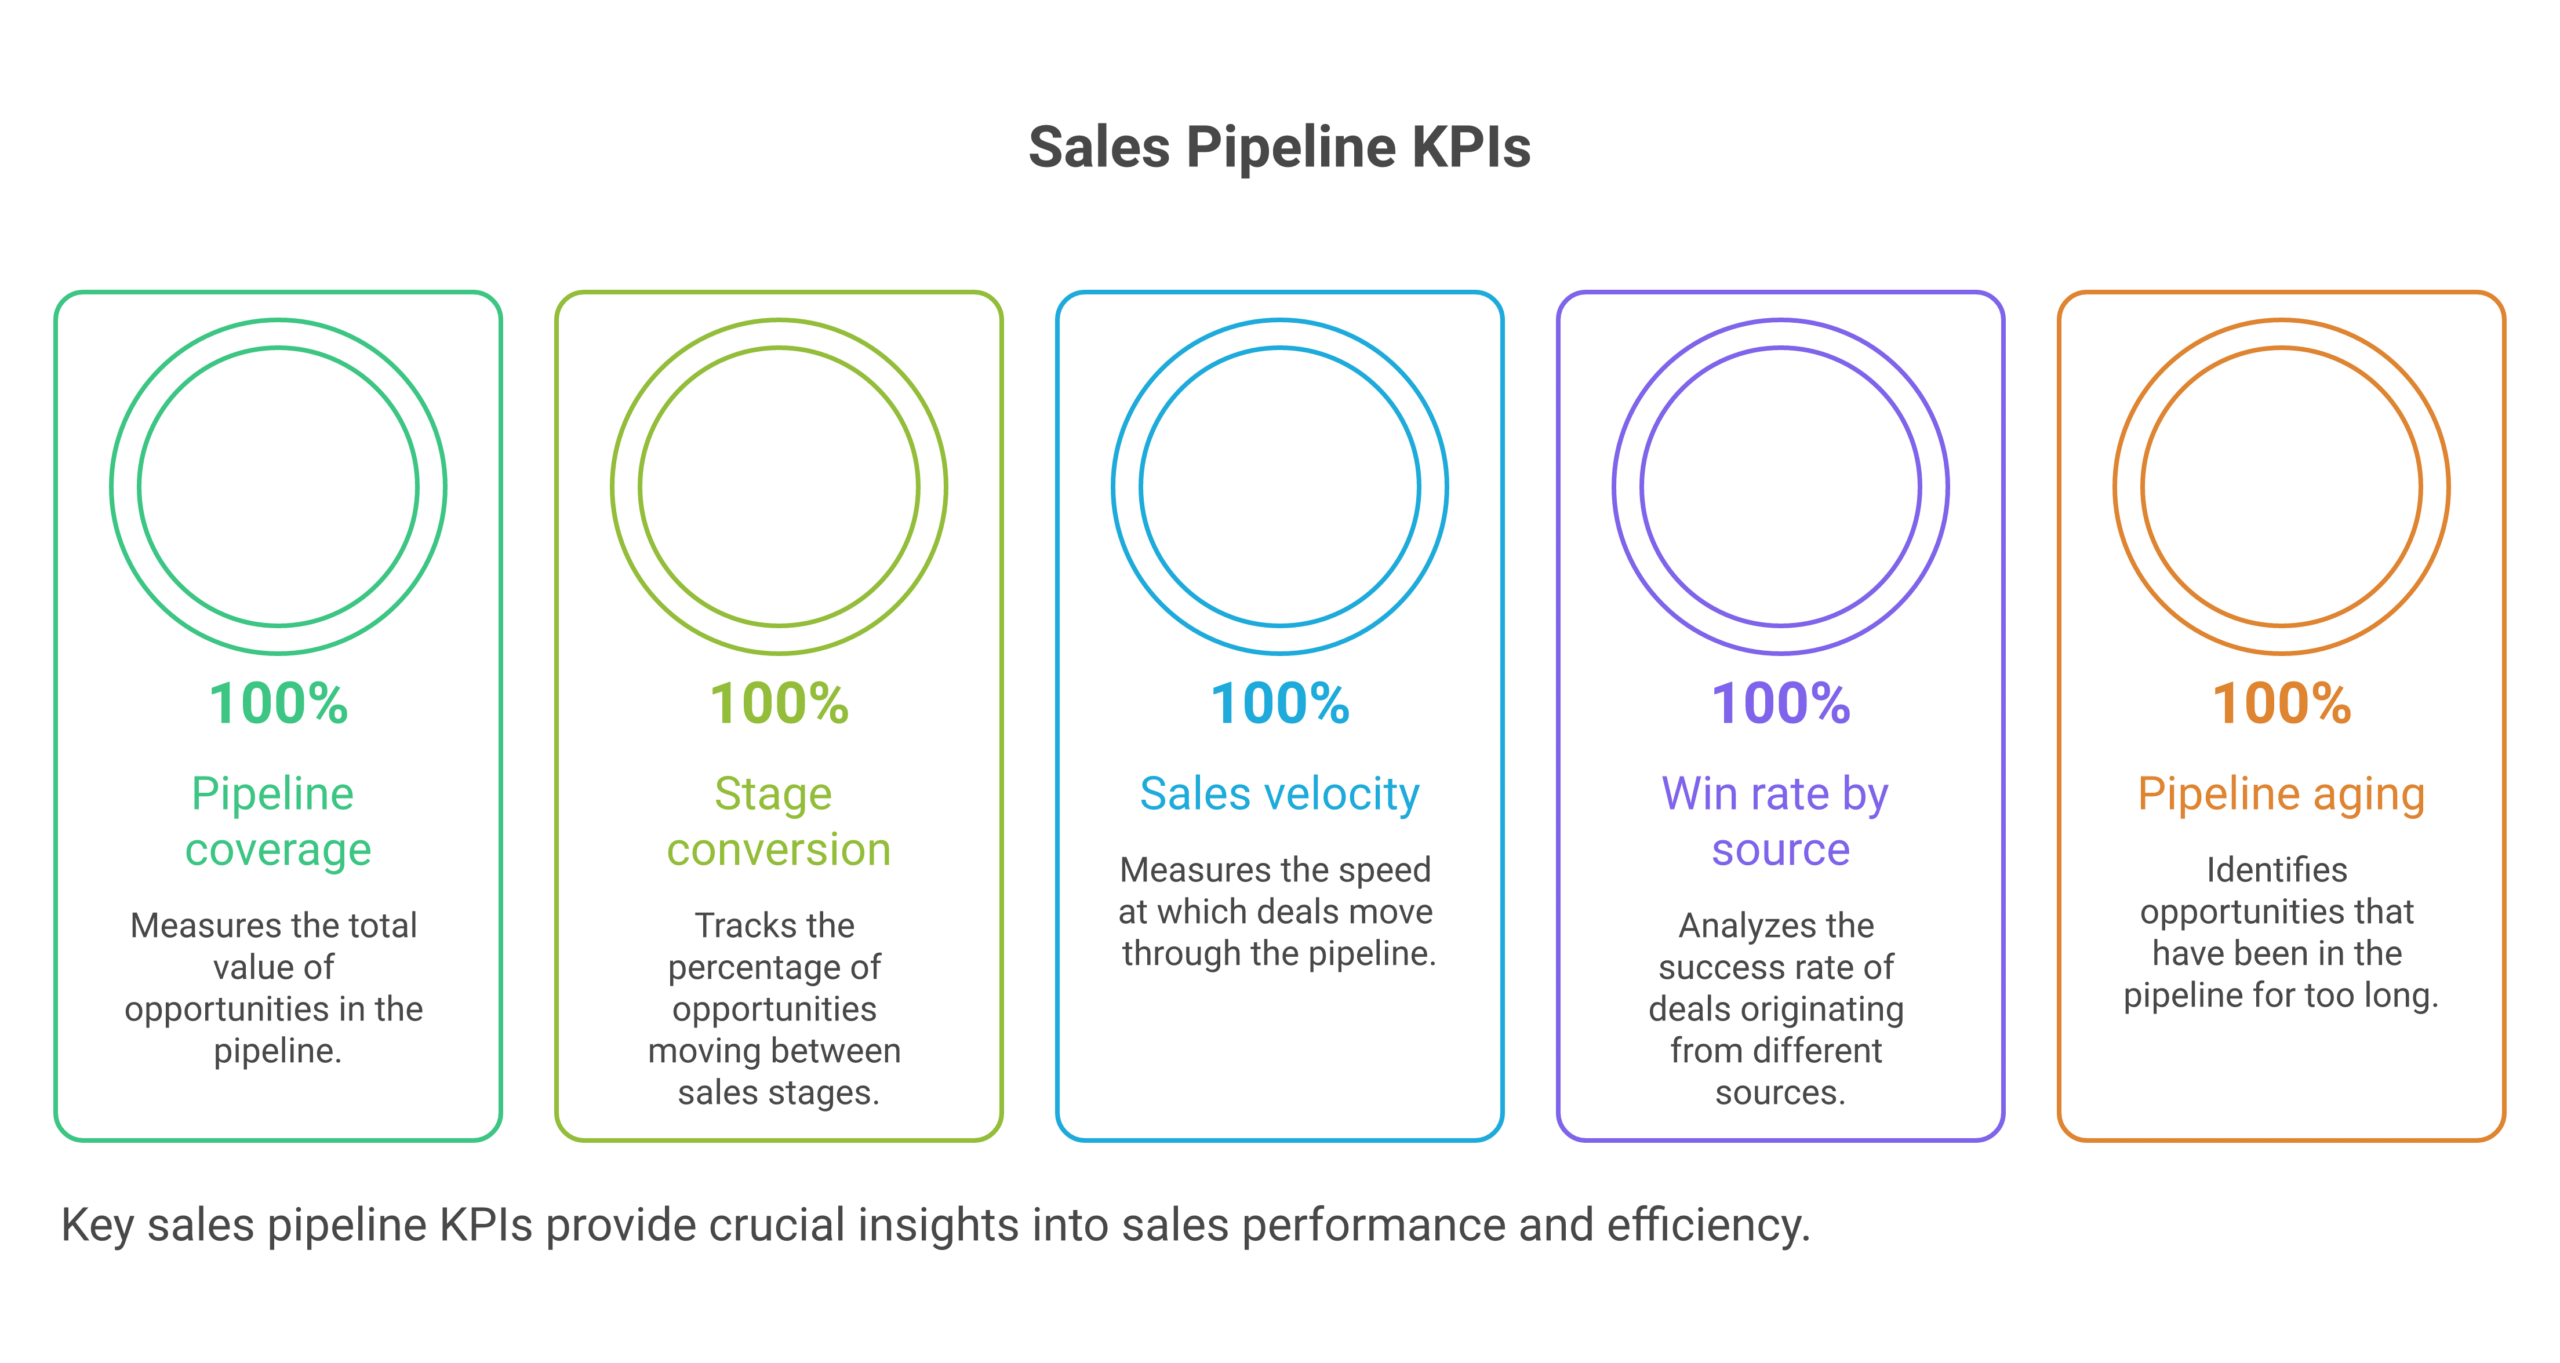
- Pipeline coverage: set a target ratio of open pipeline to quota and act when it drops below, but read it against your win rate, because the right coverage number is a function of how well you convert, not a universal 3x.
- Stage conversion: hold a target conversion rate at each stage and trigger a review when one falls, since this is the KPI that tells you where the pipeline leaks rather than only that it leaked.
- Sales velocity: track the speed at which pipeline becomes revenue, combining deal count, win rate, deal size, and cycle length, because a pipeline that converts well but slowly still misses the quarter.
- Win rate by source: set and watch win rate split by channel, not as one blended figure, because the blend averages your strong and weak sources into a number that owns nothing.
- Pipeline aging: cap how long deals sit at each stage and flag the ones past it, since stale deals inflate coverage with opportunities that are already dead.
The through-line is that a KPI set should be small enough to act on and split by source. Five owned numbers with thresholds beat thirty unowned ones, and the source split is what keeps a weak channel from hiding inside a healthy-looking blend.
Common pitfalls
- Confusing metrics with KPIs: filling a dashboard with numbers that have no target and no owner, so nothing on it ever triggers a decision.
- Too many KPIs: tracking twenty indicators instead of five, which buries the ones that predict the quarter under the ones that merely describe it.
- Coverage without conversion: setting a coverage target with no reference to win rate, so a 3x number feels safe on a pipeline that converts at 5 percent.
- One blended win rate: reporting a single win rate across all sources, which describes no channel and owns no decision.
- Missing the source KPI: never tracking win rate and pipeline by source, so partner-sourced deals, usually the best-converting, never appear as their own owned line.
What this looks like in practice
A board review opens with a pipeline dashboard of twenty tiles, almost all green. Coverage is 3.4x and the forecast is confident. The CRO adds two KPIs the dashboard never isolated: stage conversion trend and win rate by source. Conversion has been sliding for two quarters, masked by rising volume, and the blended win rate hides that outbound converts at 6 percent while a small partner-sourced channel converts at 30 percent. With those two KPIs on the board, the conversation changes from admiring the coverage number to assigning an owner to the conversion slide and funding the partner channel that was quietly carrying the quarter. The data existed the whole time; it was not a KPI because no one owned a threshold on it.
That is the difference between a dashboard and a KPI set. The tiles described the pipeline; the two owned numbers changed what the board did about it.
Forecastable’s POV
Most pipeline dashboards are built to be looked at, not acted on. The fix is ruthless subtraction: pick the five numbers that change a decision when they move, attach a threshold and an owner to each, and delete the rest from the board. A KPI that no one owns and no one acts on is decoration.
The source KPI is the one I insist on, because it is the one most often missing. Win rate and pipeline by source is what exposes which channel actually carries the forecast, and it is where partner-sourced pipeline usually hides, credited to whichever rep logged the next activity. At Forecastable we are a partnerships operating platform that connects partner conversations and actions to CRM pipeline and revenue, so partner-sourced pipeline becomes a KPI with its own line and its own owner instead of disappearing into a blended total.
My bet: the teams that cut their pipeline dashboard to five owned KPIs, one of them by source, are the ones whose board reviews turn into decisions instead of status updates.
Forecastable is an independent third-party. Any tools, vendors, or third-party figures referenced here are described from public information for the reader’s own evaluation, not as paid placements.
Frequently asked questions
What are the most important sales pipeline KPIs? Pipeline coverage, stage conversion, sales velocity, win rate by source, and pipeline aging. Each should carry a target threshold and an owner, because a KPI without accountability is just a metric on a dashboard.
What is the difference between a sales metric and a KPI? A metric is a number you watch; a KPI is a number with a target and an owner that triggers a decision when it crosses its threshold. Most dashboards confuse the two and end up full of metrics and short on KPIs.
How many pipeline KPIs should a team track? Few enough to act on, usually around five. Tracking twenty indicators buries the ones that predict the quarter under the ones that merely describe it, so subtraction is the real skill.
What is a good pipeline coverage KPI target? It depends on your win rate. A team converting at 30 percent needs far less coverage than one converting at 10 percent, so a coverage target only means something set against a known conversion rate rather than a generic 3x.
Why should win rate be a KPI by source? Because channels convert at widely different rates, and a single blended win rate owns no decision. Split by source, it reveals which channel carries the forecast, including partner-sourced deals that usually convert best and hide inside the blend.
How do pipeline KPIs connect to the forecast? The forecast is only as credible as the conversion and velocity KPIs under it. A forecast built on owned, threshold-bearing KPIs by source is one a board can act on; a dashboard of unowned metrics is not.
Next step
Cut your pipeline dashboard to five KPIs this week, attach a target and an owner to each, and add win rate by source if it is not already there. A board acts on owned thresholds, not on green tiles.
If the source KPI shows partner-sourced pipeline carrying more than its share, that is what we instrument. Start your growth journey with Forecastable and we will make partner-sourced pipeline a KPI with its own owner. Our sales pipeline management guide covers the operating model, and the sales pipeline metrics guide covers the measures beneath the KPIs.
Uncover Your Growth Potential
Schedule a Discovery Call