Sales Pipeline Metrics: The Ones That Predict Revenue

Short answer
Short answer: Sales pipeline metrics are the measures that describe the health, movement, and predictability of deals in your pipeline, from coverage and stage conversion to velocity and win rate. They matter because most of them flatter the forecast rather than predict it, and knowing which few actually predict revenue is the whole job.
Here is the position. A dashboard full of green numbers can sit on top of a pipeline that will miss, because volume metrics measure activity and only a handful measure conversion to cash.
What are sales pipeline metrics?
Sales pipeline metrics are the quantities a revenue team tracks to understand what is in the pipeline and whether it will close. They fall into two families. One family counts volume: number of open deals, total pipeline value, new opportunities created. The other family measures movement and conversion: stage-to-stage conversion, sales velocity, win rate, and the age of deals at each stage.
The distinction matters more than any single number. Volume metrics tell you how much is in the funnel. Conversion metrics tell you how much will come out the other end. A pipeline can grow in volume and shrink in quality at the same time, and only the conversion family will catch it.
The reason teams track these at all is to replace opinion with evidence. A forecast built on rep confidence is a guess. A forecast built on stage conversion and velocity, measured over enough deals to be stable, is a projection you can defend in a board meeting.
Why sales pipeline metrics matter in 2026
Boards stopped accepting the confident forecast that misses. When the number slips two quarters running, the next conversation is about whether the pipeline was ever real, and that is a metrics question. In 2026 the pressure is to show not just how much pipeline exists but how much of it converts, by source, with the math exposed.
Here is why the stakes rose. Go-to-market motions multiplied, so the same pipeline now mixes outbound, inbound, product-led, and partner-sourced deals that convert at wildly different rates. Reported as one blended number, the pipeline looks uniform. Split by source, it almost never is, and the blend hides which channel is actually carrying the forecast.
The teams that come out ahead treat pipeline metrics as a diagnostic system, not a scoreboard. They read conversion by stage and by source together, so a drop in one channel does not get masked by growth in another. In my work with revenue teams, the single most common failure is a healthy-looking total pipeline that is one weak channel away from a miss, invisible because nobody split the metrics by where the deals came from.
How sales pipeline metrics actually work
Sales pipeline metrics work as a layered system, where each layer answers a sharper question than the one before it and the lower layers are worthless without the upper ones.
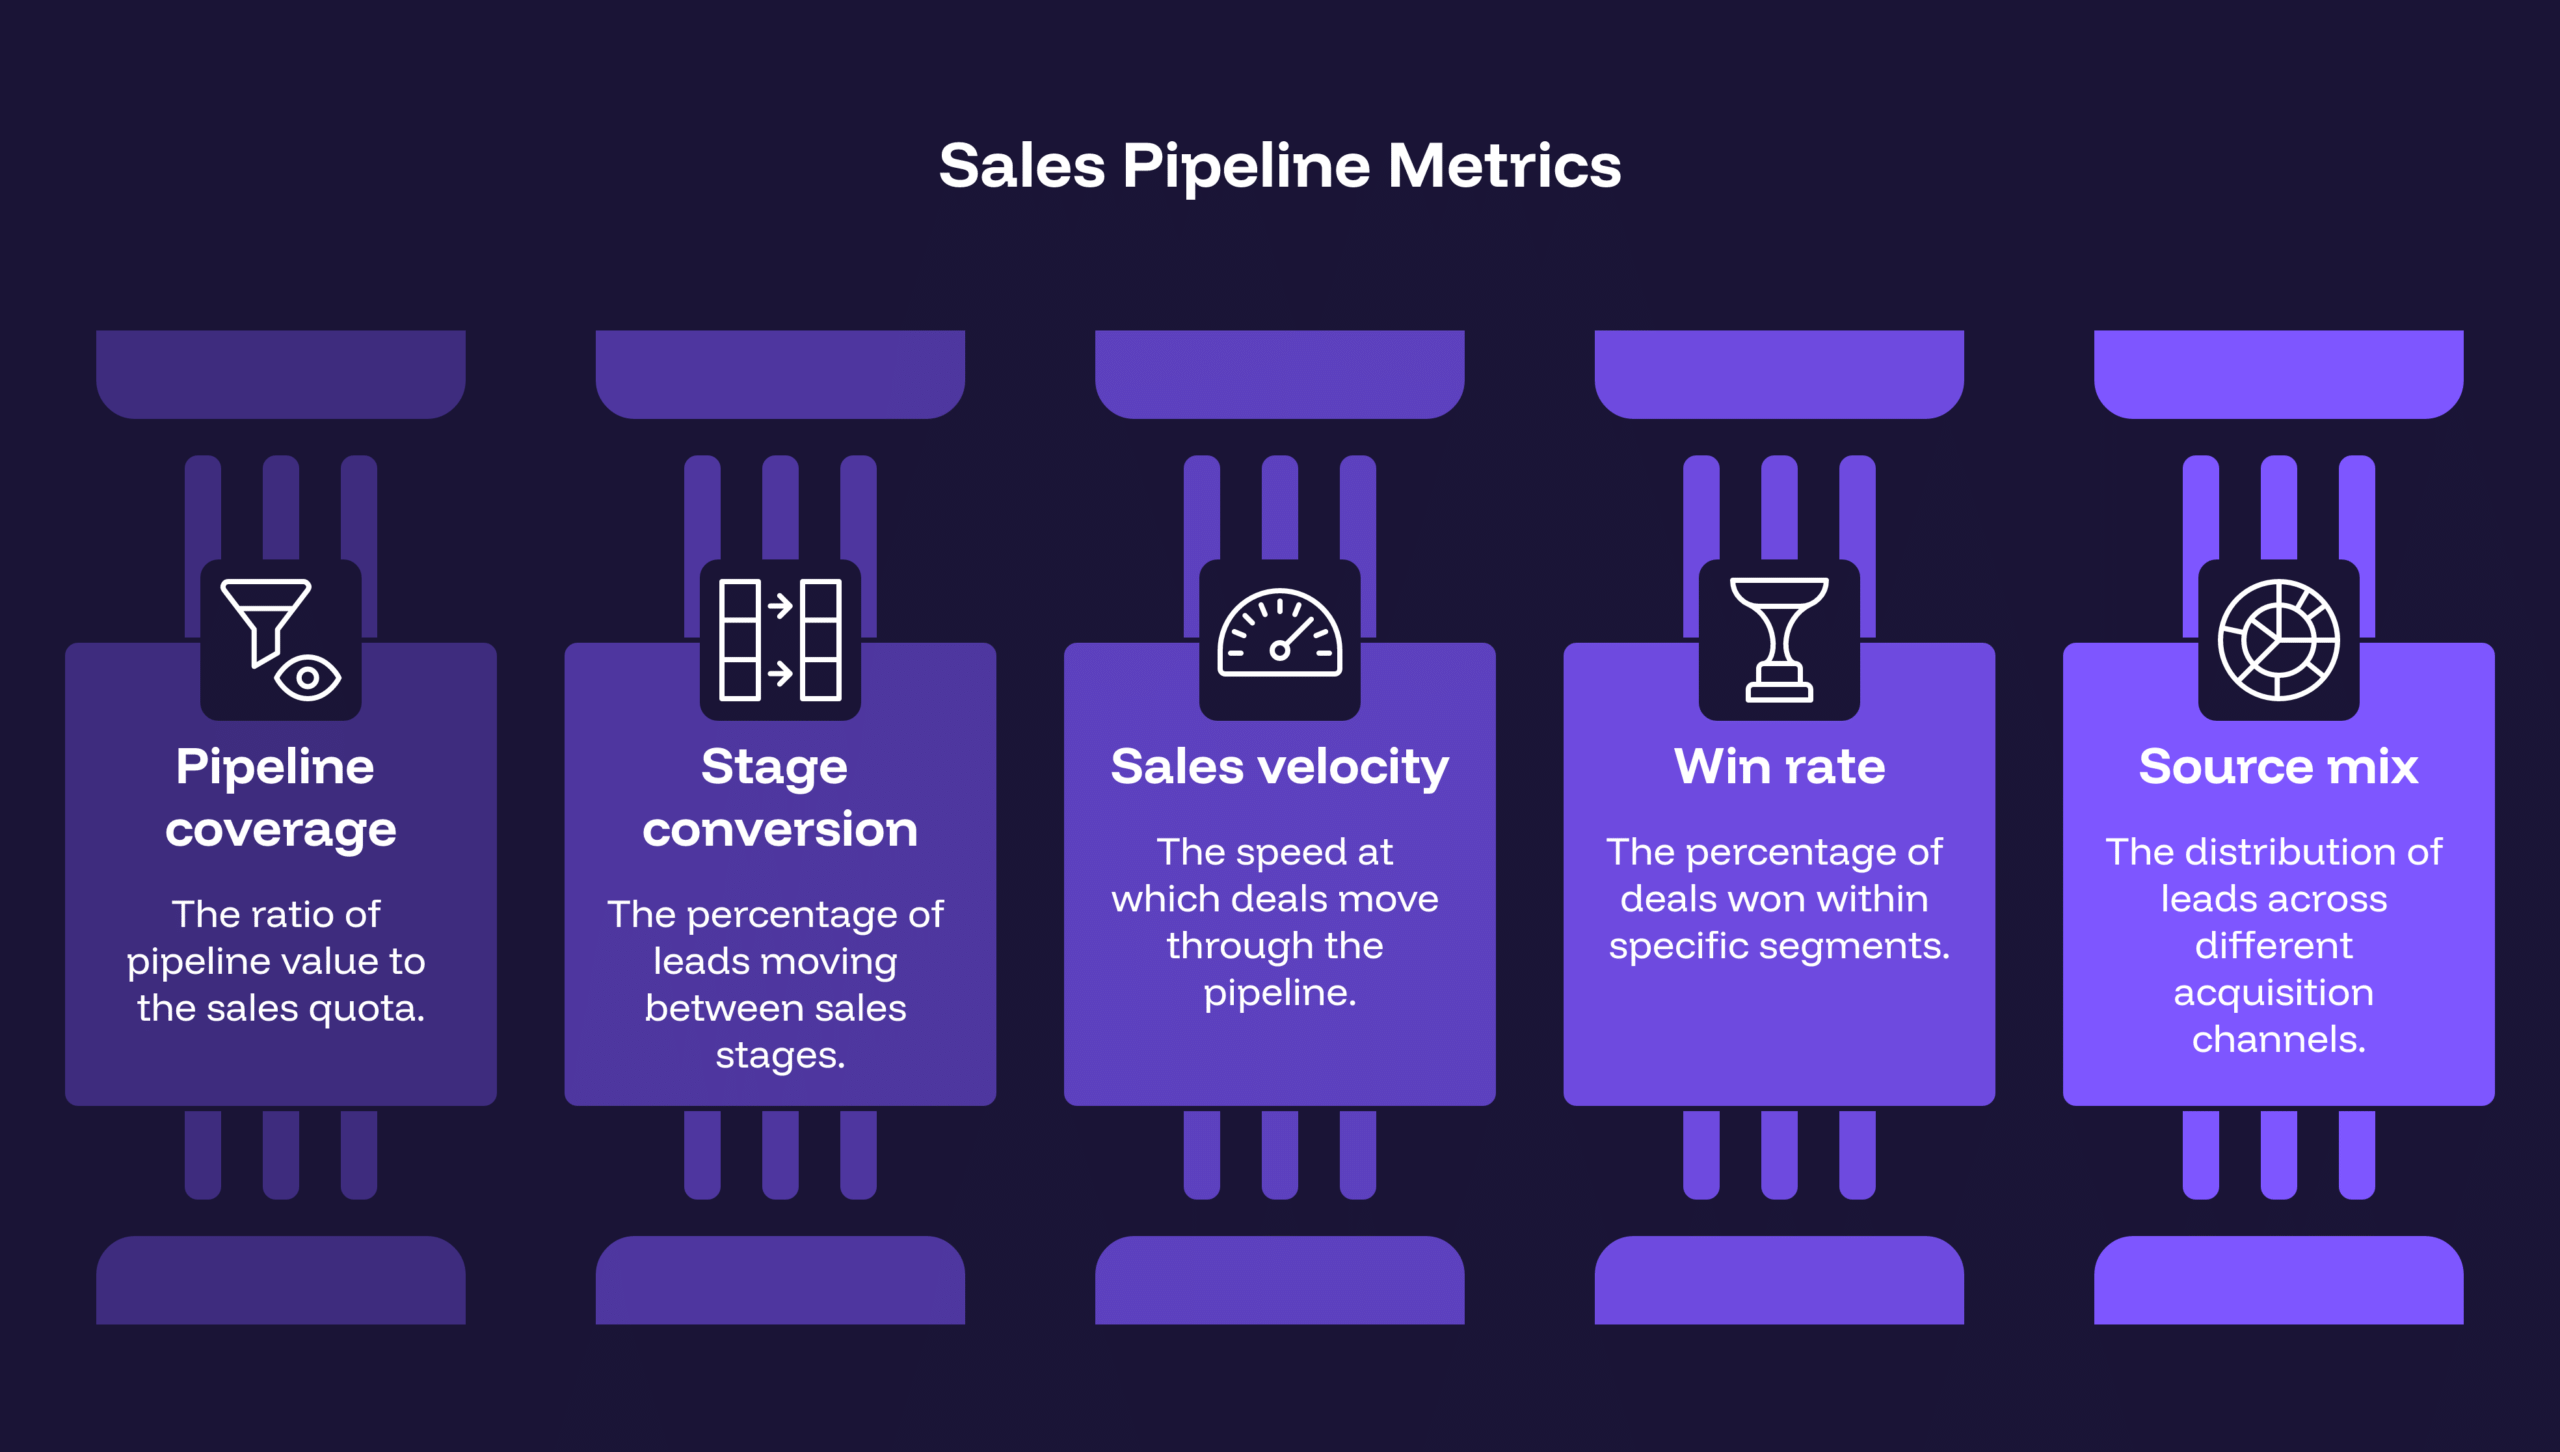
- Pipeline coverage: measure open pipeline against the quota it has to cover, because a 3x-covered quarter and a 1.5x-covered quarter are two different conversations. Coverage is the first read, and it only means something next to a known conversion rate.
- Stage conversion: track the rate at which deals move from each stage to the next, so you can see where pipeline leaks instead of only that it leaked. This is the layer that turns a total into a diagnosis.
- Sales velocity: combine deal count, win rate, average deal size, and sales cycle length into one speed-of-revenue number, because a pipeline that converts well but slowly still misses the quarter. Velocity is where time enters the math.
- Win rate by segment: measure win rate split by source, segment, and deal size, not as a single blended figure, because the blend hides which deals you actually win. A segmented win rate is the one most teams never compute.
- Source mix: attribute every open and closed deal to the channel that created it, so the forecast shows which source carries it and which is quietly shrinking. This is the layer where partner-sourced pipeline usually disappears.
The through-line is that you read up the stack, not across it. Coverage without conversion is a vanity number, conversion without source mix hides your best and worst channels, and only the full stack produces a forecast that holds.
Common pitfalls
- Watching volume, not conversion: celebrating a growing total pipeline while stage conversion quietly falls, so the number looks healthy right up to the miss.
- One blended win rate: reporting a single win rate across all sources, which averages a strong channel and a weak one into a figure that describes neither.
- No source attribution: tracking pipeline without tagging where each deal came from, so the forecast cannot tell you which channel to double down on or cut.
- Ignoring deal age: leaving stuck deals in the open pipeline at full value, which inflates coverage with opportunities that died months ago.
- Burying partner-sourced deals: crediting partner introductions to the last-touch rep, so the warmest, highest-converting source never shows up as its own line in the metrics.
What this looks like in practice
A worked example makes the stack concrete. A team walks into a quarterly review with 3.2x pipeline coverage and a confident forecast. The total looks safe. Then they split the pipeline by source. Outbound carries most of the volume, converts at 6 percent stage to close, and is slowing. Partner-sourced deals are a small slice of the volume, convert at 30 percent, and are aging fast because nobody owns the follow-up. On the blended view the quarter is covered. On the split view the quarter depends entirely on a partner channel that is leaking at the handoff. The team that only read coverage would have promised the number and missed it. The team that read conversion by source saw the risk in time to assign an owner to the partner deals and pull the quarter back.
That is the difference between a scoreboard and a diagnostic. The metrics did not change the pipeline; reading them by source changed what the team did about it.
Forecastable’s POV
Most pipeline misses are measurement failures before they are demand failures. The pipeline was there, the conversion signal was there, and the dashboard averaged it into a number that looked fine until it did not. The fix is not more metrics; it is the three that predict revenue, read by source: stage conversion, velocity, and source mix.
The source line is where I see teams lose the plot. Partner-sourced pipeline is usually the warmest and highest-converting deals in the mix, and it is also the worst-instrumented, because the introduction gets credited to whichever rep logged the next activity. At Forecastable we are a partnerships operating platform that connects partner conversations and actions to CRM pipeline and revenue, so partner-sourced deals show up as their own measurable line in the same metrics the rest of the pipeline uses, instead of vanishing into direct. Our Co-Sell Alignment Specialist is delivered as part of the service and uses the platform to keep that attribution clean from introduction to closed revenue.
My bet: the teams that retire blended pipeline totals and read conversion by source are the ones whose forecast stops surprising them two quarters out.
Forecastable is an independent third-party. Any tools, vendors, or third-party figures referenced here are described from public information for the reader’s own evaluation, not as paid placements.
Frequently asked questions
What are the most important sales pipeline metrics? The three that predict revenue are stage-to-stage conversion, sales velocity, and win rate by source. Coverage and total pipeline value are useful context, but on their own they measure volume, not whether the pipeline will close.
What is a good pipeline coverage ratio? Many teams target around 3x open pipeline to quota, but the right number depends entirely on your win rate. A team that converts at 30 percent needs far less coverage than one converting at 10 percent, so coverage only means something read next to conversion.
How is sales velocity calculated? Multiply the number of open deals by win rate and average deal size, then divide by the average sales cycle length in days. It expresses how much revenue the pipeline produces per day, which combines quantity, quality, and speed in one figure.
Why should I track pipeline metrics by source? Because outbound, inbound, and partner-sourced deals convert at widely different rates. A single blended win rate hides which channel is carrying the forecast and which is shrinking, so splitting metrics by source is how you decide where to invest.
Which pipeline metric do teams most often get wrong? Win rate reported as one blended number. It averages a strong source and a weak one into a figure that describes neither, and it almost always buries partner-sourced deals, which tend to convert several times better than cold outbound.
How do pipeline metrics connect to the forecast? The forecast is only as honest as the conversion rates under it. A forecast built on rep confidence is a guess; one built on measured stage conversion and velocity, by source, is a projection you can defend and improve.
Next step
If your pipeline review opens with total coverage, change the first slide. Split the pipeline by source and read stage conversion and velocity for each channel, then watch which source actually carries the quarter.
If the channel that converts best turns out to be partner-sourced pipeline, that is what we instrument. Start your growth journey with Forecastable and we will put partner-sourced deals in the same metrics as the rest of your pipeline. Our sales pipeline management guide covers the operating model, and the partner-sourced pipeline guide shows why a partner introduction converts warmer than a cold deal.
Uncover Your Growth Potential
Schedule a Discovery Call